Election
 John Emerson
 Matt Miller
 Darrell Spence
- Investors should prepare for higher market volatility in the aftermath of Election Day.
- Republicans will likely hold the Senate, resulting in a split Congress — an outcome that has historically resulted in higher market returns.
- Despite the uncertainty, investors should remember that company earnings, not elections, drive the stock market.
The uncertainty of 2020 continues.
After turning out in record numbers, voters awoke Wednesday morning with no clear winner declared in the U.S. presidential election. In a race that has proven to be much closer than many polls had predicted, the outcome may remain unknown for days or even weeks.
“Patience will be the key to getting through this period of political uncertainty,” says John Emerson, Vice Chairman of Capital Group International and a former U.S. Ambassador to Germany. “There are literally millions of votes that have yet to be counted — including a large number of mail-in ballots — so a delay is not that surprising. We’ve been warning about this scenario for months.”
From an investment perspective, Emerson explains, it is likely that market volatility will persist at elevated levels until President Donald Trump or former Vice President Joe Biden is declared the winner. U.S. equity markets staged a strong rally on Election Day, with the S&P 500 Index rising 1.8%. On Wednesday morning, stocks continued to climb higher amid the uncertainty as results in several key states remained too close to call. Treasuries rallied, partially on the view that a split government could curtail prospects for excessive fiscal stimulus.
“There’s understandably a lot of anxiety right now,” Emerson adds, “but investors should think hard about adhering to their long-term investment goals, rather than reacting to near-term political events. That is often a mistake.”
Stocks have trended higher regardless of which party occupies the White House
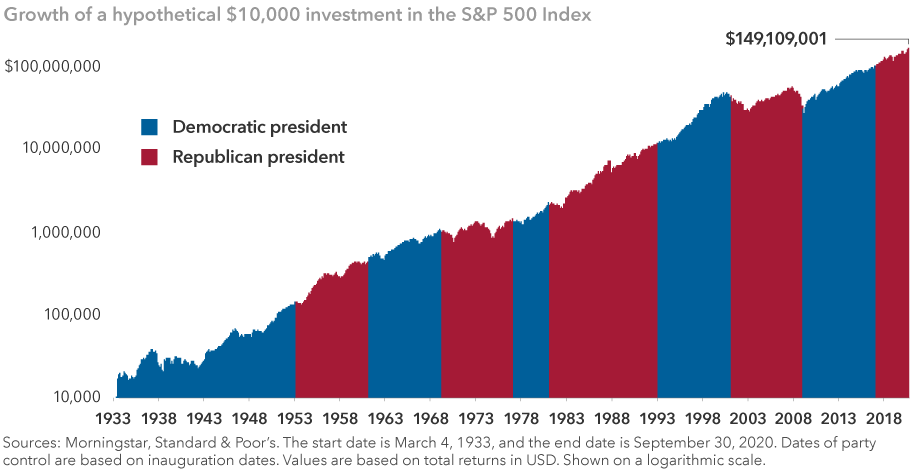
Over the course of history, markets have powered through contested presidential elections, deadly pandemics and economic recessions — usually not within the same year — but they have powered through, nonetheless. Whether a Democrat or a Republican occupies the White House has made little difference to overall long-term investment returns.
Where do we go from here?
The stage has been set for vote-counting battles and a flurry of lawsuits in swing states that have not yet been called for Biden or Trump. As of Wednesday morning, those states included Pennsylvania, Michigan, Nevada, North Carolina and Georgia, according to The Associated Press.
“Thursday or Friday is probably the earliest we will know the preliminary vote results for each state, depending on the looming litigation,” says Matt Miller, a political economist and policy analyst with Capital Group. “The presidency could go either way in the fraught overtime ahead.”

Capital Ideas™ webinars
Insights for long-term success
CE credit available
Capital Ideas™ webinars
Insights for long-term success
Looking at the initial tally on election night, the nation essentially remains just as divided as it was four years ago when Trump unexpectedly won the 2016 election. “At midnight, Biden had 64.6 million votes and Trump had 63.2 million — on the way to what might be a record 160 million total votes,” Miller notes. “Whoever wins this election will have the daunting task of trying to bring unity and healing to a nation that is split right down the middle.”
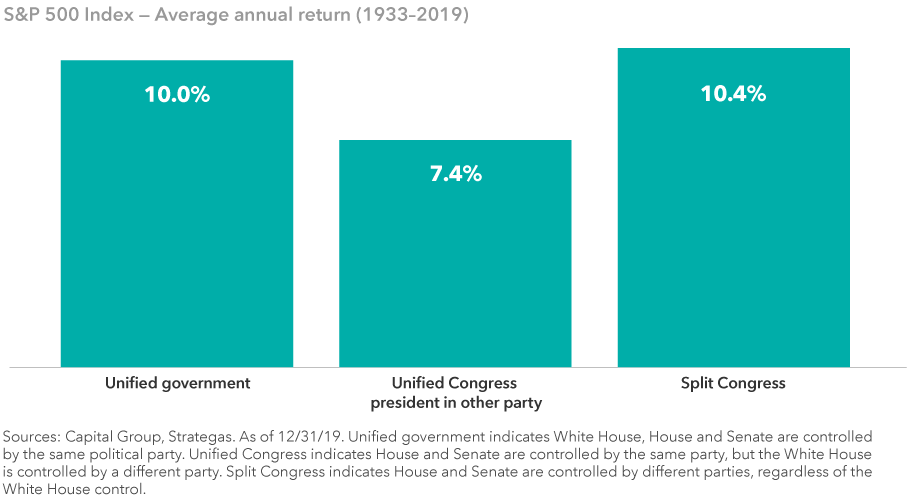
In other races, it appears likely that Republicans will hold a majority in the U.S. Senate, although that’s not certain just yet, Miller says, while Democrats will maintain control of the House of Representatives, resulting in a split Congress. That’s been the case since the 2018 midterm elections when Republicans lost the House. Coincidentally, according to our analysis, markets have performed best under a split Congress.
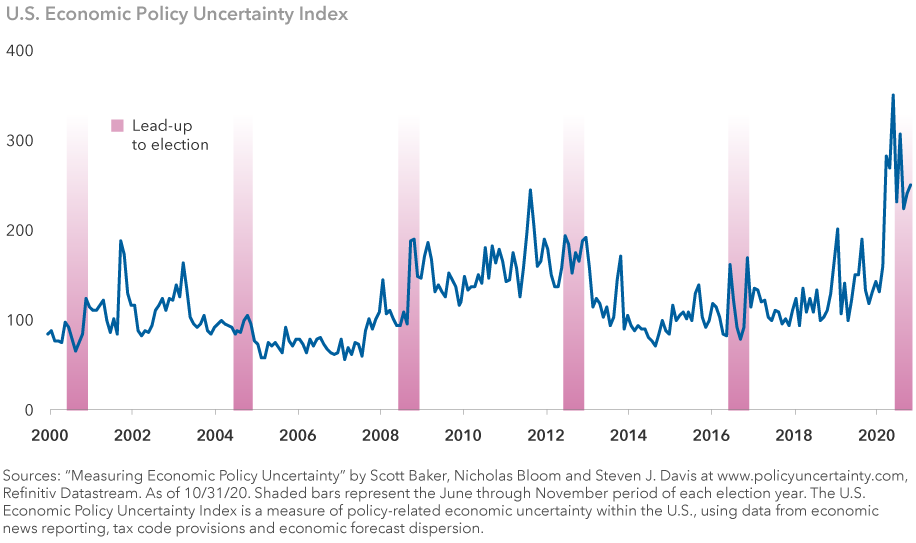
Uncertainty index is elevated and far higher than previous election cycles
Two key issues in the race
The U.S. economy and the coronavirus outbreak were the top two issues in the presidential contest, according to most polls. Trump was generally viewed unfavorably for his handling of the pandemic, while voters gave him higher marks for his economic policies. The U.S. fell into a recession earlier this year, as government-imposed lockdowns brought economic activity to a near standstill.
However, in the most recent measure of U.S. economic activity — released just five days before the election — U.S. GDP growth bounced back sharply, rising at a 33.1% annual rate, benefiting from pent-up consumer demand and massive government stimulus measures. A key driver has been U.S. home sales, which have benefited from rising demand and historically low mortgage rates.
Returns have historically been strongest when Congress is split
Despite extreme volatility during the year, U.S. equity markets also have trended upward. On a year-to-date basis through October 30, the S&P 500 Index gained 2.8% as technology and consumer-tech stocks rallied amid the lockdowns.
“The near-term performance of the economy and the markets may have played a role in this election but, realistically speaking, presidents get far too much credit and far too much blame for what is happening in the economy and the markets,” says Capital Group economist Darrell Spence. “For the most part, the dynamics that contribute to economic growth and market returns are put in place long before the election and they remain long afterward.
“As investors, we try to focus on the underlying fundamentals that are driving the economy and corporate profitability,” Spence notes. “That often has very little to do with who happens to win an election.”
The market indexes are unmanaged and, therefore, have no expenses. Investors cannot invest directly in an index.
Standard & Poor's 500 Composite Index is a market capitalization-weighted index based on the results of approximately 500 widely held common stocks.
Standard & Poor's 500 Composite Index ("Index") is a product of S&P Dow Jones Indices LLC and/or its affiliates and has been licensed for use by Capital Group. Copyright © 2020 S&P Dow Jones Indices LLC, a division of S&P Global, and/or its affiliates. All rights reserved. Redistribution or reproduction in whole or in part is prohibited without written permission of S&P Dow Jones Indices LLC
Our latest insights
-
-
Interest Rates
-
U.S. Equities
-
Municipal Bonds
-
Artificial Intelligence
RELATED INSIGHTS
-
-
Interest Rates
-
U.S. Equities
Never miss an insight
The Capital Ideas newsletter delivers weekly investment insights straight to your inbox.
Statements attributed to an individual represent the opinions of that individual as of the date published and do not necessarily reflect the opinions of Capital Group or its affiliates. This information is intended to highlight issues and should not be considered advice, an endorsement or a recommendation.