Fed
 Tom Hollenberg
The U.S. Federal Reserve signaled this week that cuts are coming, although it remained noncommittal on when they may occur and left its benchmark interest rate unchanged at a range of 5.25% to 5.50% for the fifth consecutive meeting. Fed Chair Jerome Powell also addressed the central bank’s plans for quantitative tightening (QT), indicating that it would soon begin slowing (or tapering) the rate at which it is shrinking its balance sheet, but did not provide details on when the taper would begin.
“Our securities holdings have declined by nearly $1.5 trillion since the committee began reducing our portfolio. At this meeting we discussed issues related to slowing the pace of decline in our securities holdings. While we did not make any decisions today on this, the general sense of the committee is that it will be appropriate to slow the pace of run off fairly soon,” Powell said on March 20, 2024.
The Fed’s latest median dot plot projections for 2024 also remain unchanged from December — showing the majority of Fed governors believe total cuts of 75 basis points (likely three 25-basis-point cuts) to be the most probable scenario.
Although the initial quantitative easing (QE) programs launched to stimulate the economy after the global financial crisis (GFC) were intended to be temporary, balance sheet management has since become a conventional tool used by the Fed to implement policy.
Since June 2022, the Fed has been conducting a round of quantitative tightening (QT) — slowly reducing the size of its balance sheet by allowing securities to mature and not reinvesting the proceeds. Now, as inflation nears the Fed’s target, the central bank has signaled it will pare back its quantitative tightening, meaning the balance sheet will continue to decrease but at a slower pace. Based on recent statements from Fed governors, the most realistic scenario appears to be that the central bank will begin tapering the QT program in June, assuming the Fed believes there will be sufficient liquidity in the market. Powell stated that slowing the pace of QT would not mean the Fed is changing the final target level of its balance sheet, although tapering means it would approach that target “more gradually.”
How this will affect markets remains to be seen, but slowing the balance sheet runoff should reduce the likelihood of an unintended liquidity crunch in U.S. Treasury markets, and by extension, broader risk assets.
How low can the Fed’s balance sheet go?
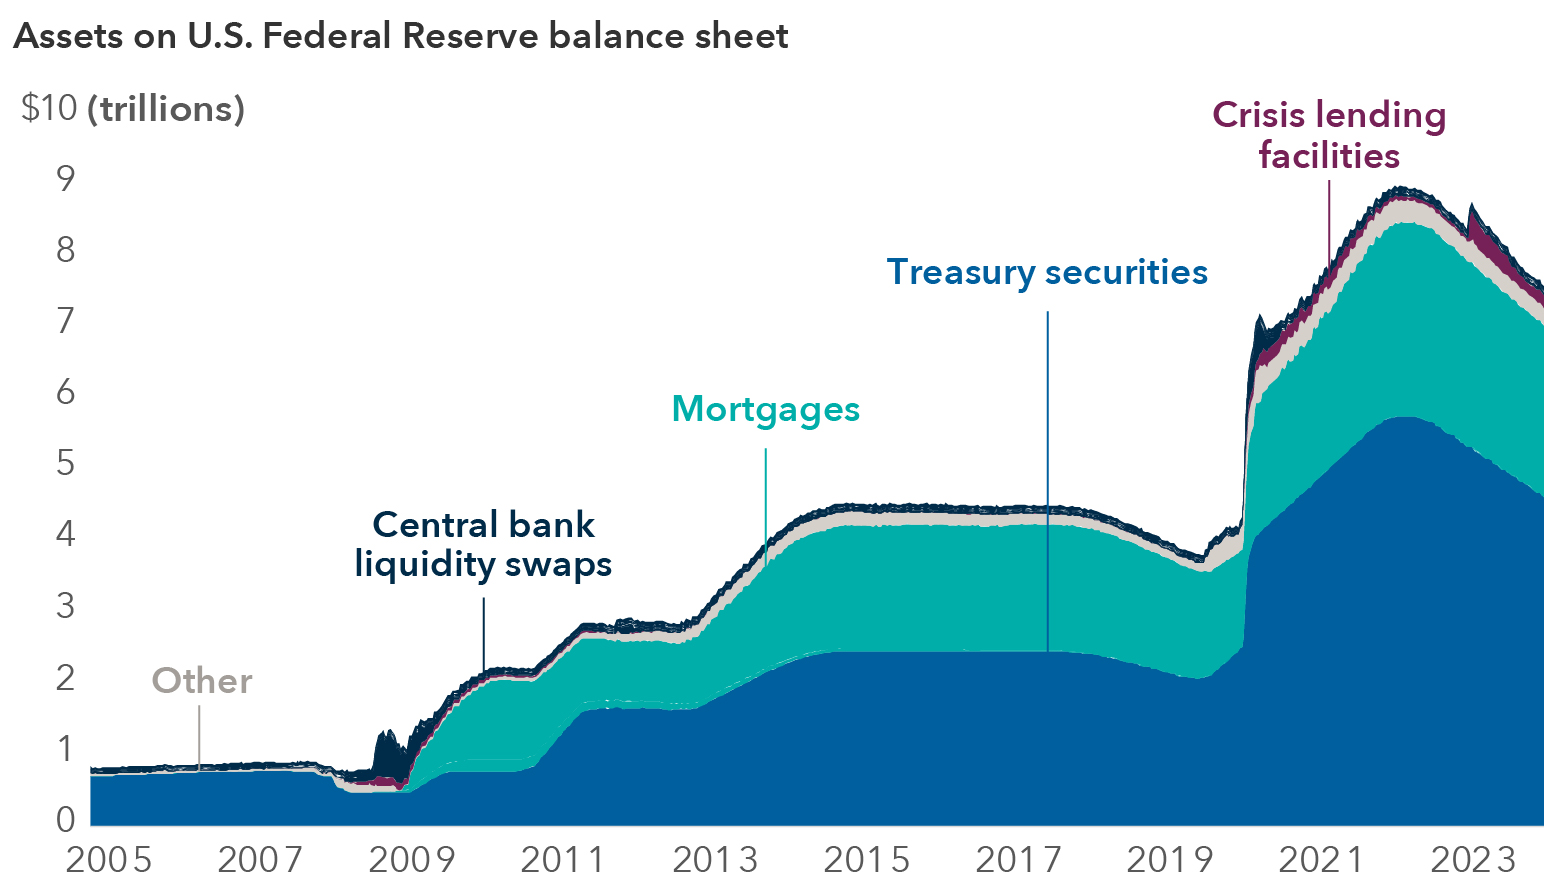
Sources: Capital Group, U.S. Federal Reserve. As of March 11, 2024. “Other” category includes federal agency debt, unamortized premiums on securities, unamortized discounts on securities, repo, float, central bank liquidity swaps, other fed assets, foreign exchange assets, gold, and special drawing rights (SDRs).
A brief history of the Fed’s balance sheet
To understand the implications of QT, and what may come next as it is phased out, it is important to understand the history of the Fed’s balance sheet and how bank reserves work in conjunction with policy rates. As the Fed continues QT and usage of its reverse repurchase (RRP) lending facility normalizes, bank reserves should come down alongside the assets on its balance sheet. This matters because, as reserves shrink, it can increase the chances of a liquidity crunch and make it more difficult for the Fed to implement policy.
Before the global financial crisis (GFC), the assets on the Fed’s balance sheet were still below the $1 trillion mark, growing with currency outstanding, and bank reserves (the Fed’s single largest liability today) sat near zero. But in 2008, the Fed made important changes to how it implements its policy.
First, when cutting rates to zero proved insufficient to pull the economy out of recession, it launched the initial round of QE, buying Treasuries and mortgage-backed securities to provide additional monetary stimulus, quickly doubling the assets on its balance sheet.
At the same time, the Fed also began to operate monetary policy differently. Before the GFC, it operated on a so-called “scarce reserves” model, where banks kept minimal assets on deposit with the Fed, and the central bank would buy and sell short-dated Treasuries in the open market to increase or decrease the supply of bank reserves in the system and align market federal funds rates with its target rate. In this system, the federal funds rate was supposed to trade in a “corridor” around the Fed’s target. But starting in 2007, it began trading well below where it should have been.
To address this, the Fed moved to an “ample reserves” framework and shifted its monetary policy to a “floor system,” paying interest on deposits to incentivize banks to maintain higher reserves with the Fed.
In conjunction with ongoing QE, the central bank’s balance sheet continued to move higher. It peaked around $4.5 trillion and leveled out between 2017 and 2019, as the Fed was conducting its first round of QT. Bank reserves grew at a similar pace over that time, hovering around $2.5 trillion.
The Fed was able to bring its balance sheet back below $4 trillion, and bank reserves shrank to around $1.5 trillion. However, it had to abandon QT in 2019 and start buying T-bills again as liquidity dried up, sparking a crisis in repo markets, where banks lend cash overnight in exchange for collateral like Treasuries.
Bank reserves represent Fed’s largest liability
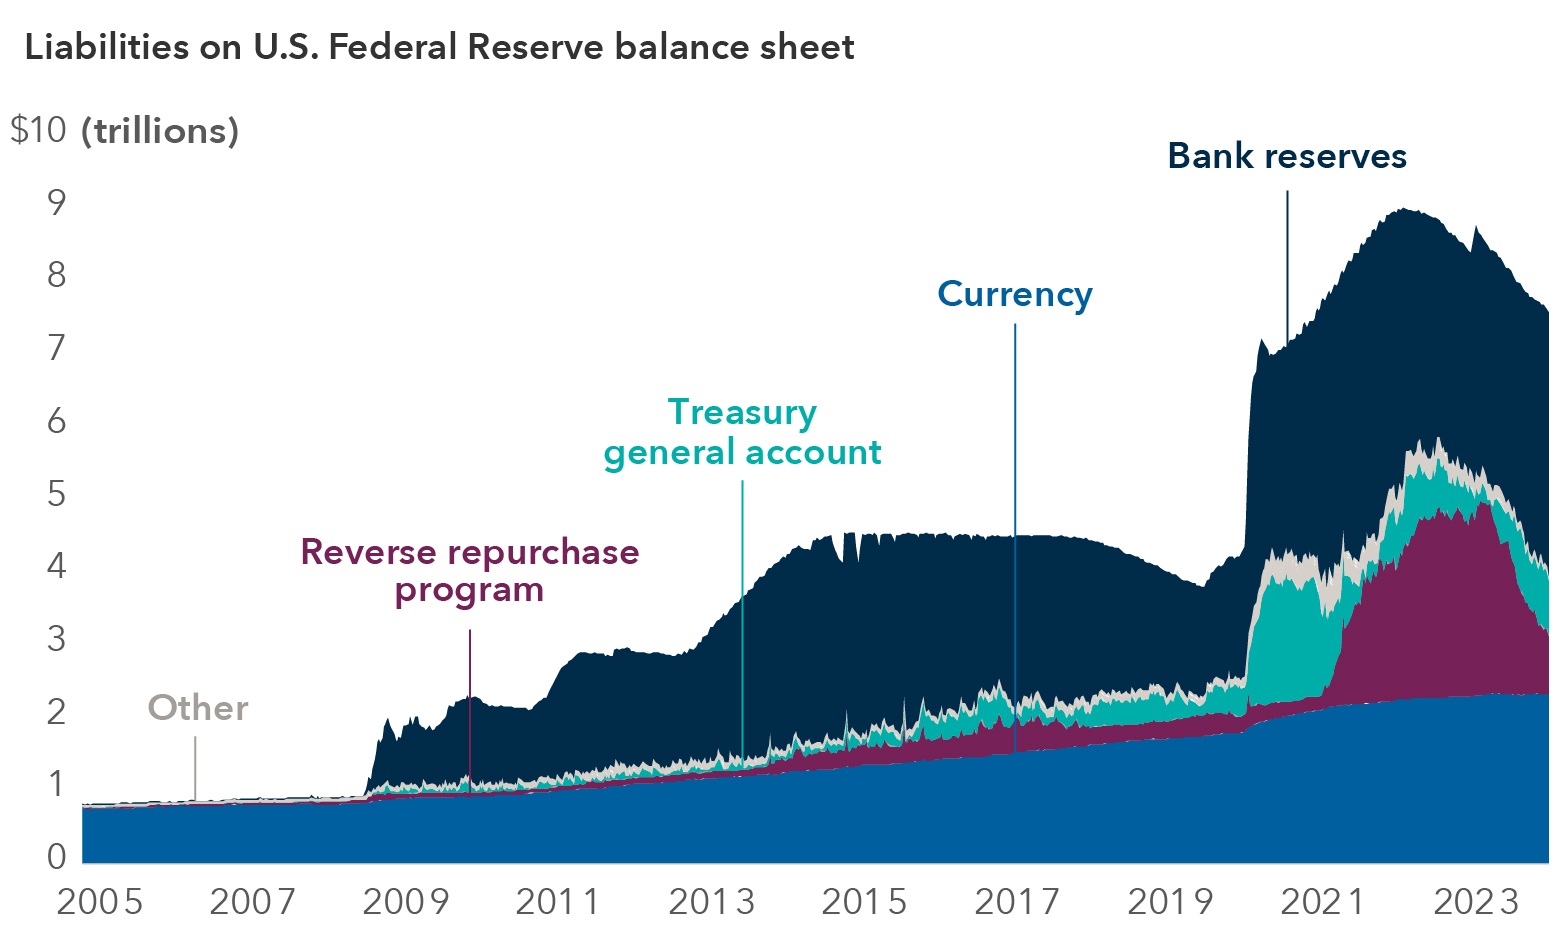
Sources: Capital Group, U.S. Federal Reserve. As of March 11, 2024. “Other” category includes Treasury cash holdings, foreign official deposits, Treasury equity to credit facilities, other deposits and other liabilities (e.g. remittances).
The beginning of the pandemic came shortly thereafter, initiating another massive round of QE, which pushed the Fed’s balance sheet to around $9 trillion and saw bank reserves soar above $4.1 trillion.
The current QT program has been in effect since mid-2022 and has sought to reduce the Fed’s assets by a maximum of $95 billion per month. Despite a slight uptick in March 2023, when the Fed injected liquidity into markets in response to the collapse of Silicon Valley Bank and others, the balance sheet has fallen to around $7.6 trillion, as of February 2024, a reduction of $1.4 trillion overall.
The effects of QT have been muted so far
Rates have gone up and the Fed’s balance sheet has contracted, but the effects of QT appear to have been muted to date as labor markets have remained resilient and economic growth has continued expanding.
One reason for this is that shrinking usage of the Fed’s overnight reverse repurchase (RRP) lending facility, where eligible investors such as banks or money market funds can invest cash risk free, has worked to counteract the Fed’s balance sheet operations.
When investors access the RRP, the money they invest is not lent out in the system – it is basically dead money. So, when the RRP was built up in 2021 and 2022, it essentially served as another form of monetary tightening. But then in 2023, the RRP started to draw down, and it had the reverse effect. Even with QT running, bank reserve balances remained above $3 trillion and actually grew as the RRP was drawn down. As RRP usage approaches $500 billion, we could start to see QT begin to bite.
Slowing QT could boost markets and protect against a new crisis
The relationship between balance sheet policy and financial conditions is not necessarily linear. It appears Federal Open Market Committee (FOMC) members are concerned that if reserves decline too far, it could put stress on the financial system. The Fed does not want to see another accident, or episode of market volatility, as happened in 2019.
Putting aside the small banking crisis of early 2023, which was more related to the inverted yield curve than QT and was quickly contained, funding stress in the market appears very limited today. Bank reserves at the Fed are double what they were in 2019, the last time QT was tapered. But in late 2023, short-term bank lending rates spiked in a way that indicated the U.S. may not have “ample funding” in the banking system. And in January, Dallas Fed President Lorie Logan, broadly considered one of the Fed’s most important voices on this topic, delivered a speech arguing the central bank should probably start to plan for a slower pace of QT once RRP balances reach their lower bound.
I believe the Fed is not just looking at aggregate levels of funding in the system, it's also looking to make sure that market participants broadly have access to liquidity. If, say, 90% of banks have ample liquidity, but 10% are having difficulties accessing funding, that's still a problem. As we saw with Silicon Valley Bank, it only takes a few players having issues to create problems for everyone.
QT could continue for an extended period
It remains to be seen how long QT will continue. At the current pace of quantitative tightening (which is capped at $95 billion per month but has only reached around $75 billion), there could still be a year of QT to go before we reach the Fed governors’ estimated “lowest comfortable level of reserves.”
It is important to note that determining the “lowest comfortable level of reserves” is not an exact science, but recent projections from the Fed indicate there could be around $600 billion in excess reserves yet to be run down. When QT is tapered, the Fed may take even longer to reach its target.
The “Fed put” is back
Tapering QT may also serve as a signaling mechanism for the Fed to tell markets where policy is going. If the Fed begins reducing its balance sheet more slowly, the market is likely going to expect that the next step will be to end QT. Looking forward from there, it could also indicate that the next time there's a downturn, markets can expect the balance sheet to start expanding again.
Overall, I believe it's going to be very hard for the balance sheet to go back to its significantly lower pre-2020 levels. Fed Governor Christopher Waller has been very transparent about this. He has talked about how running a large balance sheet is a public good, as he believes it is helpful for the implementation of monetary policy. I believe many of his peers share this point of view.
I believe the Fed would like to offload its mortgage-backed securities holdings entirely to achieve a Treasury-only portfolio. But when the next recession comes, it will be hard to avoid buying them again because the housing market is such a central part of the economy.
Aside from the inflation spike, which might be attributed to factors like fiscal policy and supply chain issues as well as Fed actions, the central bank could argue the downside of its balance sheet policy has been limited. I believe if the balance sheet gets close to $7 trillion, the Fed will likely be comfortable with that. I expect they would argue their mandate is not maintenance of the balance sheet, it is price stability and full employment, and the balance sheet is helping them achieve those things.
Thus, it seems unlikely that the so-called “Fed put” (the expectation that the Fed will step in to backstop markets when there’s trouble) is going anywhere. But there are always some political tail risk scenarios to look out for. In the late ‘70s, for example, the Federal Reserve Act was amended to include full employment as one of its mandates. If that were to be reversed and the Fed were instructed to only focus on price stability or to follow a rules-based monetary policy and ignore the balance sheet, markets could be caught off guard. I don’t believe this is likely, but one should never say never.
In conclusion, the fact that the Federal Reserve is already talking about slowing the pace of quantitative tightening may help to prevent a repeat of the liquidity crunch markets experienced in during the last round of QT. Even if QT does run longer at a slower pace, the signal from Fed officials that they are willing to change course is a positive one.
Quantitative easing — A program through which the Federal Reserve has purchased Treasury securities and mortgage-backed securities issued by government-sponsored enterprises and federal agencies to achieve its monetary policy objectives.
Quantitative tightening — A program through which the Federal Reserve has reduced the size of its balance sheet by allowing assets to mature and not reinvesting the proceeds.
Repurchase (repo) agreements — Money market transactions in which the Fed’s Open Market Trading Desk purchases securities from a counterparty subject to an agreement to resell the securities at a later date.
RRP — The Federal Reserve’s reverse repurchase (repo) lending facility, though which the Fed’s Open Market Trading Desk sells securities to eligible counterparties with an agreement to repurchase the same securities at a specified price at a specific time in the future.
Yield curve — A measure of the difference between the yields of bonds of different maturities. A yield curve is said to be inverted when shorter term bonds provide higher yields than longer term bonds.
Bank reserves — Cash held by banks on deposit with the Federal Reserve.
Our latest insights
-
-
Interest Rates
-
-
Municipal Bonds
-
Artificial Intelligence
RELATED INSIGHTS
-
Interest Rates
-
Chart in Focus
-
Municipal Bonds
Never miss an insight
The Capital Ideas newsletter delivers weekly investment insights straight to your inbox.