Interest Rates
Categories
Municipal Bonds
High income munis: 5 themes for 2024
 Chad Rach
 Gregory Ortman
February 21, 2024
As investors recalibrate opportunities and risks in bond markets following the year-end rally, one area that merits a closer look is high income municipal bonds.
The category combines the tax savings of a typical muni offering (typically municipal bonds are exempt from certain state and local taxes) with higher income relative to investment-grade core bonds. Not to be confused with a pure high-yield offering, the sector is a blend of opportunities across the investment–grade (rated BBB and above), high yield and unrated muni spaces.
High income munis are a longer duration asset class compared with other income-focused sectors, such as high-yield corporates. We believe this duration exposure could lead to relatively higher price appreciation from falling rates.
High income munis have posted strong returns after final hike in Fed rate-hiking cycles
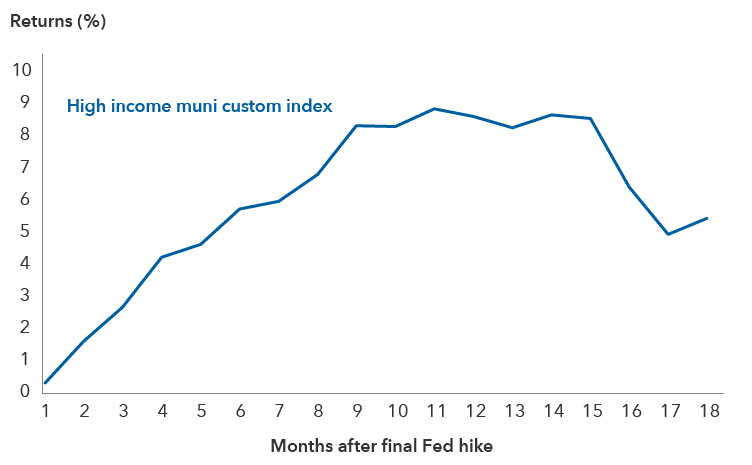
Sources: Capital Group, Morningstar. Index shown is a custom blend high income muni index composed of 60% Bloomberg High Yield Municipal Bond Index (with 5% Tobacco Cap and 2% Issuer Cap), 20% Bloomberg Municipal Bond BBB Index and 20% Bloomberg Municipal Bond Index. Chart represents the average return for the index in a forward-extending window starting in the month of the last Fed hike in the last three transition cycles (May 2000, June 2006 and December 2018) with data through 3/31/2023. Results are cumulative for periods of less than one year and annualized for periods greater than one year. Past results are not predictive of results in future periods.
Spreads narrowed broadly across the bond market during the year-end rally. Valuations appear to be pricing in a benign economic outcome, leaving little room to cushion investors against spread widening in the event of negative economic surprises. In this environment, our team’s efforts have been focused on where we believe we can add the most value as active managers, and that is primarily through credit selection and yield curve positioning.
We highlight areas where we’re finding value and where we remain more cautious.
1. Long duration profile of the asset class is attractive
The high-income muni market isn’t just about muni issuers’ creditworthiness. The category has a relatively long duration profile, with an effective duration of 7.1 years for a custom blend high income muni index compared with 6.1 years for the Bloomberg U.S. Aggregate Index and 3.3 years for the Bloomberg U.S. Corporate High Yield 2% Issuer Capped Index, as of January 31, 2024. That makes duration and yield curve positioning a key component to selecting investments for our high income municipal strategies.
Following the Federal Reserve’s dovish pivot in December, when Chair Jerome Powell indicated that the central bank may have reached a peak in policy rates and would consider rate cuts, markets have started to price in a series of rate cuts this year. While we believe the Fed may begin to lower rates sometime in 2024, we also think that market expectations are still largely ahead of the data. The Personal Consumption Expenditures (PCE) Price Index reported core inflation of 2.9% in December, which is trending in the right direction but still has ground to cover in reaching the Fed’s 2% target. Meanwhile, unemployment figures remain historically low.
That’s led some of our portfolio managers to keep a roughly neutral to slightly short duration stance, as there’s potential for volatility in interest rates as the market recalibrates its expectations. We expect that we’ll have more clarity on the economic environment and the path of rate cuts in the second half of the year, and our positioning will evolve accordingly.
We currently have higher conviction that we may see a steepening of the yield curve, which has been inverted for an extended period. However, the muni-to-Treasury ratio (a comparison of the yield of muni bonds to those of U.S. Treasuries) is relatively low – an indication that muni debt is expensive relative to Treasuries. For example, yields on five-year AAA-rated general obligation bonds versus yields on five-year Treasuries reached a relative low muni-to-Treasury ratio of 62% as of January 31, 2024. In our view, that makes a long duration position centered on five-year Treasuries attractive, given they could do better than comparable munis in the event of curve steepening.
Markets anticipate the yield curve will steepen
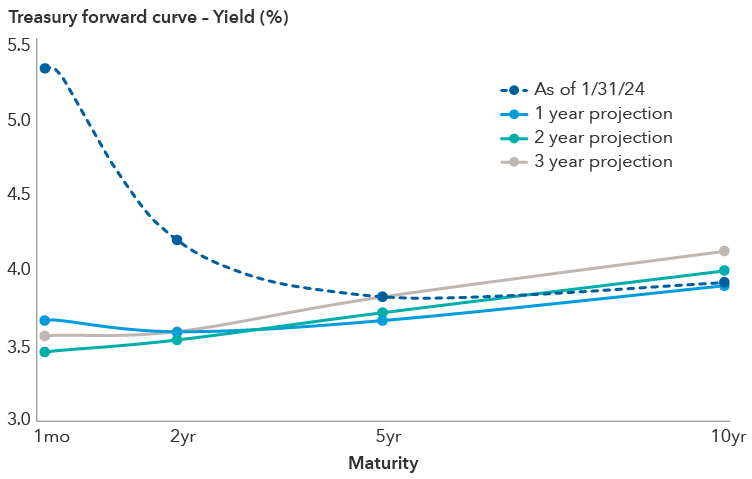
Source: Bloomberg. As of 1/31/2024. Projected rates are a measure of where Treasury yields could reach in the future and are calculated using Treasury rate futures market data.
2. Seeking opportunity in mid-quality credits
Our typical hunting ground within the high yield muni funds managed by the team lies in the AA- to B-rated space. But we’ve been shifting our attention to higher rated credits given current spreads and valuations. We’re finding the best relative value in the AA-rated to BBB-rated space and prefer these types of mid-quality credits.
We’ve been surprised by the resilience in muni bond spreads. High nominal losses for munis in 2022 and parts of 2023 would have usually resulted in a decline in investor demand for munis, leading to spread widening. Yet that hasn’t happened in a meaningful way, even in the face of recent economic softening. This makes the lowest quality parts of the muni market largely unattractive.
Spread compression has led to weaker relative value for lower quality munis
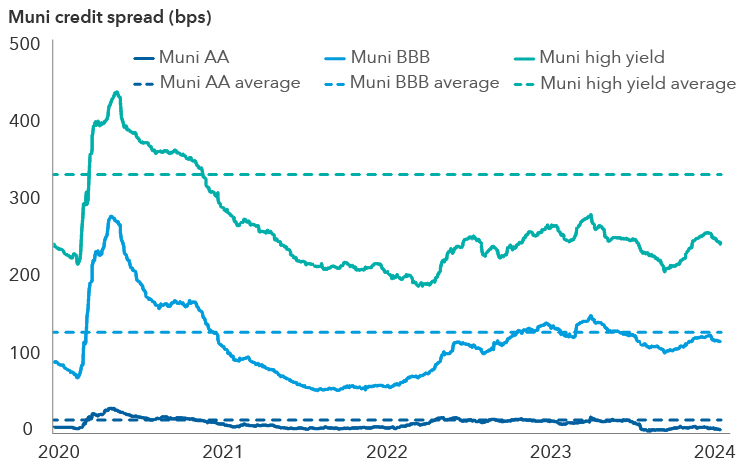
Source: Bloomberg. Data as of 1/31/2024. Muni AA represented by the Bloomberg Municipal AA Index. Muni BBB represented by the Bloomberg Municipal BAA Index. Muni high yield represented by the Bloomberg Municipal Bond: High Yield (non-investment grade) Index. Spreads reflect the difference in the respective indices’ yield to worst and the Bloomberg Municipal AAA Index.
We find spread levels on BB-rated and lower credits to be particularly low. We’re cautious about certain sectors in this bucket, such as tobacco (which involves debt backed by tobacco revenue streams), as valuations appear too low relative to fundamentals, and we would need a better risk premium to allocate more investor capital to the sector.
Rosy market predictions for rate cuts may collide with the reality of a cautious Fed and lead to a weakening in the market. We believe focusing on higher quality bonds, such as BBB-rated debt, which have relatively limited potential for spread widening, is prudent.
3. Finding shelter in housing
Housing, senior living and the tax allocation segment are a few of our favored areas of the market.
Within housing, we favor debt on everything from Freddie Mac guaranteed multifamily bonds to planned amortization class (PAC) notes and California workforce housing debt. We’re finding compelling structures and levels in many parts of the market. For example, we’ve found select AA-rated PAC credits at spreads that are comparable to levels on broader B-rated munis. These bonds, which involve mortgages made to lower income borrowers guaranteed by the federal government, give us the opportunity to move up in credit quality without sacrificing yield.
A mixed bag for fundamentals highlights the need for security selection within senior living bonds; the industry faces operational headwinds from staffing shortages to margin compression, though it could benefit from favorable demand dynamics amid an aging U.S. population. We’ve gravitated toward projects in favorable locations that are often run by not-for-profit issuers that have a religious or other long-term orientation in their market. We believe there is potential for considerable spread tightening on select stronger issuers in the space.
Tax allocation bonds, which are often used to fund infrastructure and redevelopment projects, offer interesting risk-reward tradeoffs. We continue to find opportunities in bonds issued to fund land acquisitions for single-family housing developments, with most of the debt concentrated in projects located in suburban Denver, CO. These bonds offer relatively high yields and we’re comfortable with the risk given strong long-term demand drivers in the region, which we’ve witnessed through on-site research trips.
Wide yield dispersion among varying high income muni sectors
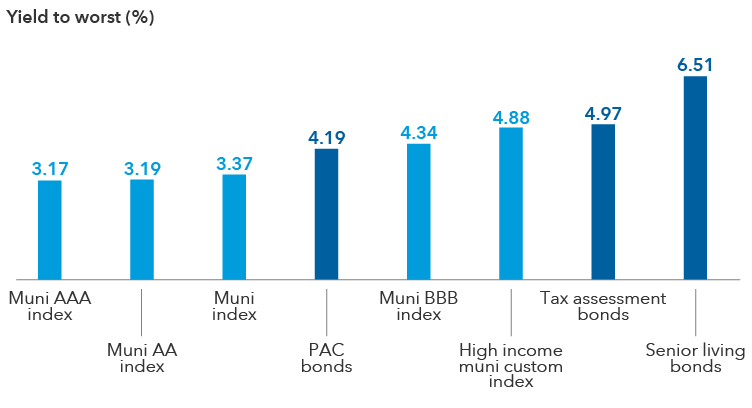
Sources: Capital Group, Aladdin. Data as of 1/31/2024. Muni AAA represented by the Bloomberg Municipal AAA Index. Muni AA represented by the Bloomberg Municipal AA Index. Muni index represented by the Bloomberg Municipal Bond Index. Muni BBB represented by the Bloomberg Municipal BAA Index. High income muni custom index is composed of 60% Bloomberg High Yield Municipal Bond Index (with 5% Tobacco Cap and 2% Issuer Cap), 20% Bloomberg Municipal Bond BBB Index and 20% Bloomberg Municipal Bond Index. Yields for the tax assessment and senior living segments are pulled as a subset from the high-income muni custom index. Yields for PAC bonds are based on Capital Group analysis. PAC = planned amortization class.
4. Absence of rating can be an opportunity, not a barrier
The unrated debt category may be an anomaly within the broader fixed income market, but it’s a common feature within munis. It’s often interpreted to imply weak credit quality, smaller deal sizing or low liquidity. Still, some of the largest and most actively traded muni bonds fall within this bucket since institutional investors regularly conduct their own research to determine creditworthiness.
Unrated munis span a diverse set of industries
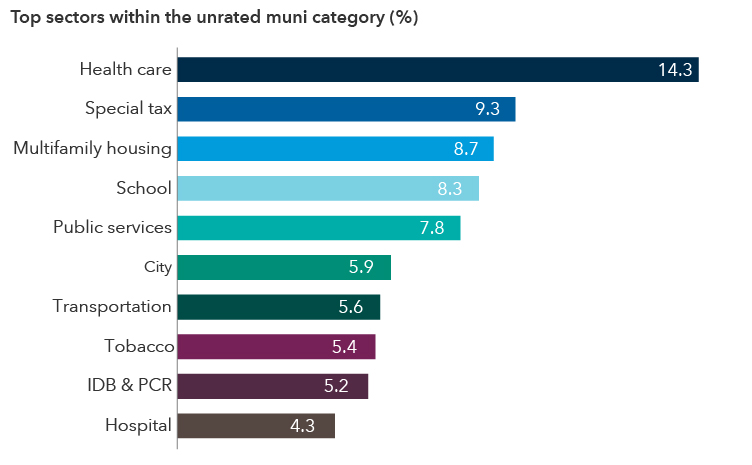
Source: Aladdin. Data as of 12/31/2023. Figures reflect sector exposure by market value within a custom blend high income muni index composed of 60% Bloomberg High Yield Municipal Bond Index (with 5% Tobacco Cap and 2% Issuer Cap), 20% Bloomberg Municipal Bond BBB Index and 20% Bloomberg Municipal Bond Index. IDB = industrial development bonds. PCR = pollution control revenue bonds.
We’re finding opportunities in several large parts of the Puerto Rico market, which is largely unrated. The island, which sought a form of bankruptcy protection several years ago, has been making strides in improving its credit profile. We see the potential for spread tightening, especially if they opt to secure credit ratings on their debt. They have the potential to land relatively strong credit ratings for several borrowing structures, perhaps even reaching into investment grade territory.
On the flip side, we’re cautious about our exposure to unrated issuers in the tobacco space and find their valuations are often out of sync with fundamentals. We’re treading lightly here given declining smoking consumption trends. Our focus on strong credit research helps us uncover relative value and avoid potential pitfalls within the unrated category.
5. A good entry point on an absolute and relative basis
The bond market rally in December showed how quickly markets can turn. While yields have declined from their recent highs, they remain historically elevated and still offer opportunity. Average yields on the custom blend high-income muni index have more than doubled from 2.1% in mid-2021 to 4.9% as of January 31, 2024.
What’s more, yields on high-income munis are at times outstripping levels on high-yield corporate bonds on a tax-adjusted basis. For example, the high-income muni custom blend index delivered a tax-equivalent yield of 8.28% for the highest tax bracket compared with average yields of 7.8% on the Bloomberg U.S. Corporate High Yield 2% Issuer Capped Index as of January 31, 2024. That yield advantage extends down into some lower tax brackets as well.
Relative to corporate high-yield bonds, the pickup in yield is striking given that high-income munis feature relatively lower credit risk, limited default risk and relatively stronger diversification from equities.
Leaning into high income munis
Given its exposure to both credit and duration, the outlook for high-income munis is positive but somewhat dependent on the path of the economy and monetary policy. With inflation not entirely contained, we believe caution is warranted on future rate expectations. Still, we believe we may be at or near the end of the current rate hiking cycle, which can present an opportunity for bondholders.
For investors looking for ways to add income exposure, high income munis may offer an attractive alternative to the taxable high-yield market. A mix of attractive nominal yields, high duration exposure to capture price appreciation from falling rates, and attractive relative value opportunities could help to drive healthy returns this year. The potential for slowing economic growth and eventual Fed rate cuts make the category’s relatively higher credit quality and duration profile an attractive option for investors seeking strong income opportunities.
Learn more about
1 The high-income muni custom blend index is composed of 60% Bloomberg High Yield Municipal Bond Index (with 5% Tobacco Cap and 2% Issuer Cap), 20% Bloomberg Municipal Bond BBB Index and 20% Bloomberg Municipal Bond Index.
The value of fixed-income securities may be affected by changing interest rates and changes in credit ratings of the securities.
Lower rated bonds are subject to greater fluctuations in value and risk of loss of income and principal than higher rated bonds.
Bloomberg Municipal Bond Index is a market-value-weighted index designed to represent the long-term investment-grade tax-exempt bond market. This index is unmanaged, and its results include reinvested distributions but do not reflect the effect of sales charges, commissions, account fees, expenses or U.S. federal income taxes.
Bloomberg Municipal Bond AAA Index is a market-value-weighted index representing the AAA-rated portion of the Bloomberg Municipal Bond Index. This index is unmanaged, and its results include reinvested distributions but do not reflect the effect of sales charges, commissions, account fees, expenses or U.S. federal income taxes.
Bloomberg Municipal Bond AA Index is a market-value-weighted index representing the AA-rated portion of the Bloomberg Municipal Bond Index. This index is unmanaged, and its results include reinvested distributions but do not reflect the effect of sales charges, commissions, account fees, expenses or U.S. federal income taxes.
Bloomberg Municipal Bond BAA Index is a market-value-weighted index representing the BAA-rated portion of the Bloomberg Municipal Bond Index. This index is unmanaged, and its results include reinvested distributions but do not reflect the effect of sales charges, commissions, account fees, expenses or U.S. federal income taxes.
Bloomberg U.S. Aggregate Index represents the U.S. investment-grade fixed-rate bond market. This index is unmanaged, and its results include reinvested dividends and/or distributions but do not reflect the effect of sales charges, commissions, account fees, expenses or U.S. federal income taxes.
Bloomberg U.S. Corporate High Yield 2% Issuer Capped Index covers the universe of fixed-rate, non-investment-grade debt. The index limits the maximum exposure of any one issuer to 2%. This index is unmanaged, and its results include reinvested distributions but do not reflect the effect of sales charges, commissions, account fees, expenses or U.S. federal income taxes.
Bloomberg High Yield Municipal Bond Index is a market-value-weighted index composed of municipal bonds rated below BBB/Baa. This index is unmanaged, and its results include reinvested distributions but do not reflect the effect of sales charges, commissions, account fees, expenses or U.S. federal income taxes.
© 2024 Morningstar, Inc. All rights reserved. The information contained herein: (1) is proprietary to Morningstar and/or its content providers; (2) may not be copied or distributed; and (3) is not warranted to be accurate, complete or timely. Neither Morningstar nor its content providers are responsible for any damages or losses arising from any use of this information. Past performance is no guarantee of future results.
The after-tax (or tax-equivalent) yield of a municipal bond investment is the yield a taxable bond would have to offer to equal the same amount as the tax-exempt bond. Highest federal tax rate assumes the 3.8% Medicare tax and the top federal marginal tax rate for 2024 of 37%, for a total federal tax rate of 40.8%. Tax-equivalent yield calculation is yield to worst/(1-(federal tax rate)).
The Personal Consumption Expenditures (PCE) Price Index provides a measure of prices that people living in the United States, or those buying on their behalf, pay for goods and services. The core inflation figure strips out the volatile food and energy categories.
Credit spread - A credit spread is the difference in yield (the expected return on an investment over a particular period of time) between a government bond and another debt security of the same maturity but with different credit quality.
Duration measures a bond’s sensitivity to changes in interest rates. Generally speaking, a bond's price will go up 1% for every year of duration if interest rates fall by 1% or down 1% for every year of duration if interest rates rise by 1%.
Inflation – The rise in the prices of goods and services, as happens when spending increases relative to the supply of goods on the market – in other words, too much money chasing too few goods. Core inflation metrics strip out volatile items like food and energy.
Liquidity – Liquidity describes the degree to which an asset or security can be quickly converted into cash without a significant concession in price.
Yield to worst is the lowest yield that can be realized by either calling or putting on one of the available call/put dates or holding a bond to maturity.
Our latest insights
-
-
-
Municipal Bonds
-
Artificial Intelligence
-
Target Date
RELATED INSIGHTS
Never miss an insight
The Capital Ideas newsletter delivers weekly investment insights straight to your inbox.
Investments are not FDIC-insured, nor are they deposits of or guaranteed by a bank or any other entity, so they may lose value.
Investors should carefully consider investment objectives, risks, charges and expenses.
This and other important information is contained in the fund prospectuses and summary prospectuses, which can be obtained from a financial professional and should be read carefully before investing.
Bond ratings, which typically range from AAA/Aaa (highest) to D (lowest), are assigned by credit rating agencies such as Standard & Poor's, Moody's and/or Fitch, as an indication of an issuer's creditworthiness.
The return of principal for bond funds and for funds with significant underlying bond holdings is not guaranteed. Fund shares are subject to the same interest rate, inflation and credit risks associated with the underlying bond holdings.
There may have been periods when the results lagged the index(es) and/or average(s).
The indexes are unmanaged and, therefore, have no expenses. Investors cannot invest directly in an index.
Source: Bloomberg Index Services Limited. BLOOMBERG® is a trademark and service mark of Bloomberg Finance L.P. and its affiliates (collectively "Bloomberg"). Bloomberg or Bloomberg's licensors own all proprietary rights in the Bloomberg Indices. Neither Bloomberg nor Bloomberg's licensors approves or endorses this material, or guarantees the accuracy or completeness of any information herein, or makes any warranty, express or implied, as to the results to be obtained therefrom and, to the maximum extent allowed by law, neither shall have any liability or responsibility for injury or damages arising in connection therewith.
Statements attributed to an individual represent the opinions of that individual as of the date published and do not necessarily reflect the opinions of Capital Group or its affiliates. This information is intended to highlight issues and should not be considered advice, an endorsement or a recommendation.
All Capital Group trademarks mentioned are owned by The Capital Group Companies, Inc., an affiliated company or fund. All other company and product names mentioned are the property of their respective companies.
Use of this website is intended for U.S. residents only. Use of this website and materials is also subject to approval by your home office.
American Funds Distributors, Inc.
This content, developed by Capital Group, home of American Funds, should not be used as a primary basis for investment decisions and is not intended to serve as impartial investment or fiduciary advice.