Fixed Income
 Pramod Atluri
With inflation falling and the U.S. Federal Reserve (Fed) signaling an end to its historic tightening cycle, the landscape for bond investors is beginning to look much clearer. Even after a sharp rally in late 2023, yields still look more attractive than they have in a decade.
The Fed’s inflation target is within striking distance and rates could come down quickly if growth continues to cool. The prospects of owning duration appear positive. There are also opportunities in yield curve positioning. Cash equivalents may look less compelling as the Fed lowers interest rates, directly reducing its return potential while also creating strong demand for bonds that should bolster returns for that asset class.
Economic outlook: Inflation in the rearview mirror
The inflation fight may not be finished, but the end appears in view. Many Capital Group analysts believe headline and core inflation will be within striking distance of the Fed’s 2% target in the next six to 12 months.
Near-term inflation data shows Fed target is within reach
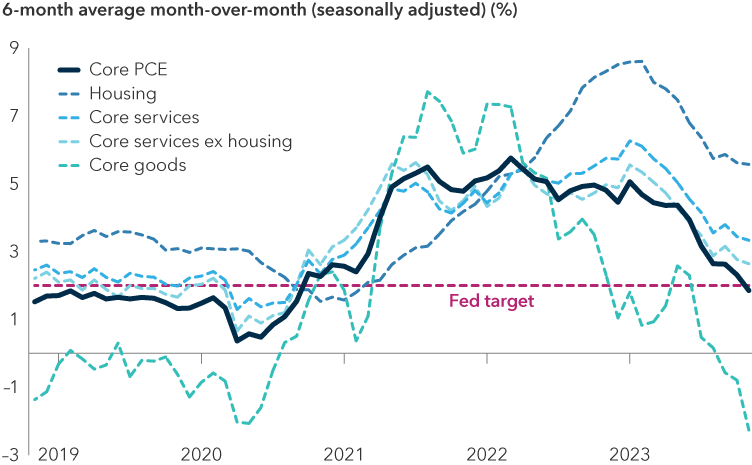
Source: Bureau of Economic Analysis. As of December 22, 2023. Chart shows a 6-month annualized month-over-month average of the core Personal Consumption Expenditures (PCE) index (excluding energy and food) and various sub-components of that index.
U.S. economic growth, which was surprisingly resilient in 2023, also appears to be leveling off. Despite the fastest hiking cycle in four decades, a banking crisis in March, a housing recession and a commercial real estate downturn, economic growth was not only positive but accelerated to almost 5% in the third quarter. However, it finally seems to be cooling. The latest data shows labor market slack increasing and wage growth moderating to a level that would be consistent with economic growth of 1% – 2%.
Meanwhile, I expect recession risks to remain relatively low. Certain segments of the economy are weak – particularly those sectors most sensitive to interest rates, like commercial real estate. Yet despite these pockets of weakness, I see many factors that could create potential.
For example, we are seeing a pick-up in productivity, which should maintain support for healthy corporate profits and wage growth. And real wages (adjusted for inflation) should see an even greater boost as rapidly falling inflation is leading to even greater purchasing power that should continue to support consumer spending.
I also expect lower interest rates to have several other positive impacts. The housing sector should be a primary beneficiary in terms of sales activity, construction and a wave of refinancings, which should positively impact consumer spending. An improvement in auto sales is also likely as financing terms improve. Finally, lower rates should boost financial asset valuations, leading to a continued trend of higher household wealth, higher consumer spending, and a stable to lower savings rate.
On top of the boost from lower interest rates, I expect the historically large fiscal deficit to continue to support economic growth over the next year. There is still a tailwind being provided from the economic stimulus bills that were passed in 2021 and 2022 (CHIPS and Science Act, Inflation Reduction Act, and Infrastructure Investment and Jobs Act).
Many struggling economic sectors have started to rebound
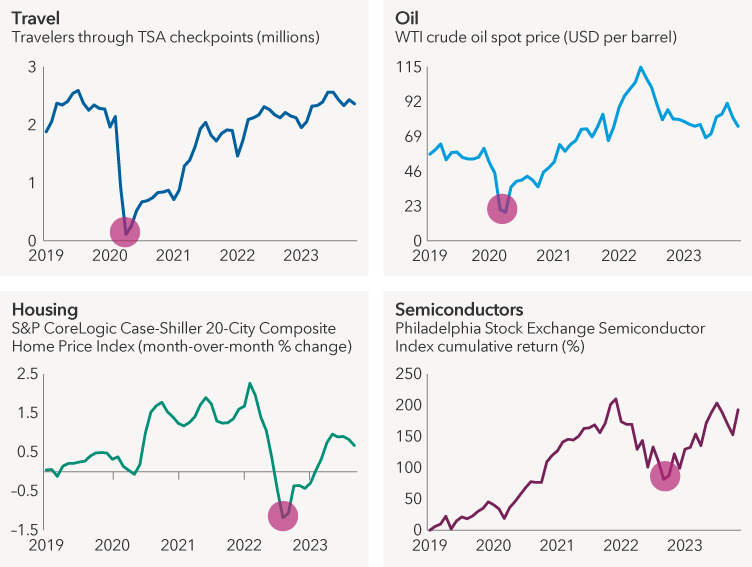
Sources: Travel: Transportation Security Agency (TSA), U.S. Department of Homeland Security. Data is a 30-day moving average. As of November 30, 2023. Oil: Refinitiv. As of November 30, 2023. Housing: Standard & Poor's. Latest available monthly data is September 2023, as of November 30, 2023. Semiconductors: Philadelphia Stock Exchange. As of November 30, 2023. Data represents cumulative price return since January 1, 2019. Past results are not predictive of results in future periods.
The greatest risk to my positive outlook for 2024 is a re-acceleration of inflation, leading the Fed to pivot back to a hawkish stance. But when our analysts study the components of the consumer price index (CPI) and personal consumption expenditures (PCE) price index, they feel confident the downward inflation trend should continue for at least 6 – 12 months. Many of the largest components of the indices (such as rents) are falling, and these declines should feed into the indices over an extended period. More real-time inflation trends (such as 3-month and 6-month annualized inflation) are already showing inflation at or near the Fed’s 2% target.
Against this backdrop, I have a positive outlook for fixed income returns in the coming year. Here are five core bond themes that I expect in 2024.
1. Duration: time to buy
If the view of falling inflation and softer growth is right, interest rates will likely continue to drop as the Federal Reserve cuts policy rates over the next two years. Since the December Fed meeting, the focus has shifted from how long the Fed will stay at 5.5% or higher, to when cuts will begin and how many there will be. Current Fed guidance is for approximately three cuts of 25 basis points (bps) in 2024 and four additional cuts in 2025. That would represent a fairly long and drawn-out cutting cycle. There is some historical precedent for that, but it would be quite unusual. I believe if core inflation approaches 2.5% by mid-2024, the Fed will likely enact rate cuts at a far more rapid pace.
In October 2023, core personal consumption expenditure (PCE), which is the Fed’s preferred inflation metric, fell to 3.4%. With the Federal Funds rate at an upper bound of 5.5%, that puts the policy rate minus inflation (also known as the “real monetary policy rate”) at 2.1%. Fed Chair Jerome Powell described this policy stance as “well into restrictive territory.” In November, core PCE fell further to 3.2%. If this trend continues, and the Fed stands still, then the real monetary policy rate will rise and become even more restrictive even as inflation and growth move closer to the target. This is why I expect the Fed to cut interest rates much more rapidly than their guidance. Not only do they need to match the path of inflation, but they have to do more to move from a restrictive stance to one that is moving toward neutral.
To be conservative, let’s assume that the Fed wants to bring the real monetary policy rate down to 1% as inflation falls below 2.5% by the end of 2024. This implies the Federal Funds target rate should fall to 3.5%. With today’s rate at 5.5%, that would entail almost 200 bps of cuts by the end of 2024. In this scenario, I think core bond portfolios could generate attractive returns throughout 2024.
If growth falters as some economists forecast, it is very reasonable to expect the Fed to cut even further. Every 50 bps that interest rates fall represents around a +3% return for a typical core bond fund with a duration of around 6 years, giving bonds the potential to provide even greater total returns and a measure of protection to investors in a downside scenario.
In addition to owning duration, there are compelling relative value opportunities along the yield curve. Positioning for a steeper yield curve should benefit investors in 2024. If growth remains steady as the Fed lowers interest rates, this should result in a yield curve that has a more normal upward-sloping shape. But I think the yield curve could steepen even more than this because large government deficits should put more pressure on longer maturity treasuries leading to a more upward-sloping curve.
Market expects quicker rate cuts in 2024
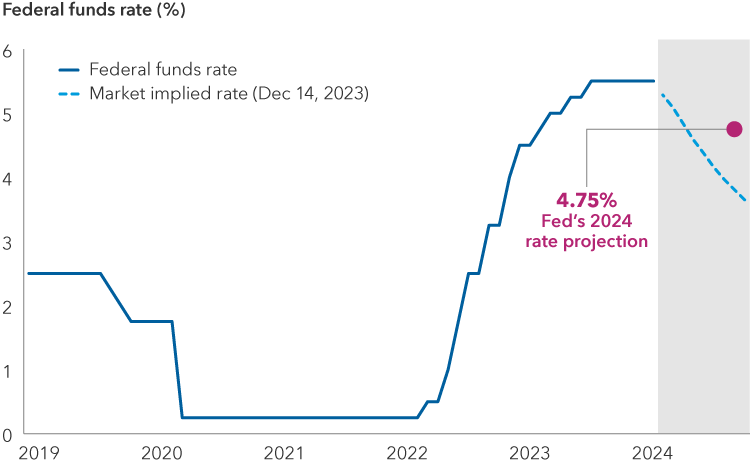
Sources: Capital Group, Bloomberg, Federal Reserve. Data as of December 14, 2023.
2. Credit: time to take profits
Corporate bonds, the best-performing sector of the Bloomberg U.S. Aggregate Index in 2023, are becoming less attractive as spreads and yields have fallen significantly. To be clear, a constructive outlook for the U.S. economy in 2024, including a more accommodative Fed that is cutting rates, should still support sectors like corporate credit. However, valuations no longer appear cheap.
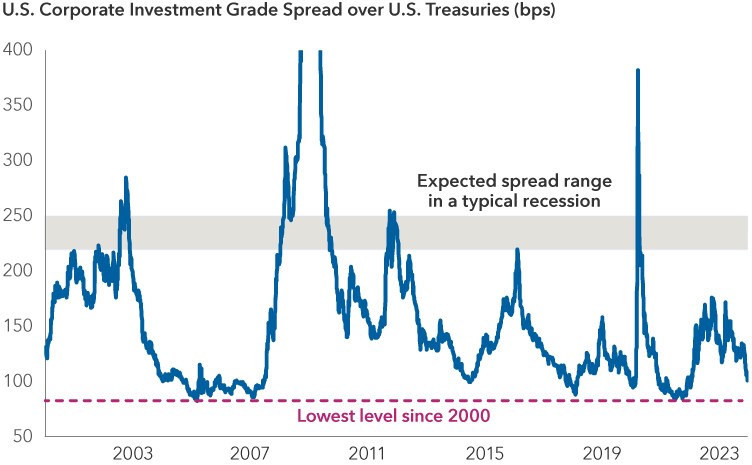
The spread on the Bloomberg U.S. Corporate Investment Grade Index narrowed to around 100 bps at the end of 2023 after peaking near 170 bps during the March banking crisis. At this level, investors earn just around 1% more than U.S. Treasuries for a portfolio of corporate bonds with greater risks.
If an economic shock emerges in 2024 or the economic outlook darkens, the margin of error reflected in credit valuations appears very thin. As fixed income investors, we always deal with asymmetric returns. When things go well, investors receive their promised yield and the par value of a bond when it matures. But when things go poorly, investors can be left with much less. Therefore, it is prudent for fixed income investors to pay great attention to how much upside remains relative to the potential downside.
Let me offer an illustrative example: For every 100 bps that spreads fall, the Bloomberg U.S. Corporate Investment Grade Index (with a duration near 7 years) generates around an extra 7% of excess return over comparable Treasuries. When corporate bond spreads were at 170 bps, there appeared to be around 90 bps of upside before they would reach their multi-decade lows of around 80 bps. The downside, in comparison, was 50 – 80 bps, considering spreads have tended to reach 220 – 250 bps in a typical recession. Now with spreads at around 100 bps, the upside/downside ratio has shifted. There is likely around 20 bps of upside vs 120 – 150 bps of downside. That’s approximately 1.4% upside in excess returns (not including income) vs. -8.4% to -10.5% of downside. The asymmetry in the risk relative to reward is no longer skewed in the favor of investors.
Ultimately, in my base case expectation of a benign economic environment in 2024, I believe corporate credit should deliver some modest positive excess returns. Investors who choose to own corporate bonds may want to consider moving up in quality. This should add resilience to portfolios without sacrificing much return potential.
3. Securitized: poised for a better year
The bias for higher quality assets can also be reflected via opportunities in agency mortgage-backed securities (MBS) and senior tranches of securitized credit. These sectors are very high quality (mostly AAA-rated) and very liquid. I believe they have a positive outlook and should generate excess returns over Treasuries similar to or better than corporate bonds in a sector that is much higher quality, more liquid, and should have better resilience in a downside economic scenario.
Because falling interest rates could lead to a refinancing wave of higher coupon mortgages, I believe there are a lot of opportunities for active managers to deliver additional value via security selection. My preference is to skew the core portfolios I manage towards mortgages that trade below par ($100) because they are more protected from the damaging impact of refinancing prepayments.
Another tailwind for mortgage-backed securities is the potential for falling interest rate volatility. Mortgage valuations tend to improve when interest rate volatility falls. This is because the securities contain a prepayment option that hurts investors when volatility is high and there is a greater chance that the homeowner will prepay their mortgage. Although rate volatility has fallen from a multi-year high in 2023, it is still highly elevated by historical standards and could continue falling into 2024 as the Fed’s interest rate policy becomes more certain and interest rates fall alongside inflation.
Interest rate volatility still has room to fall
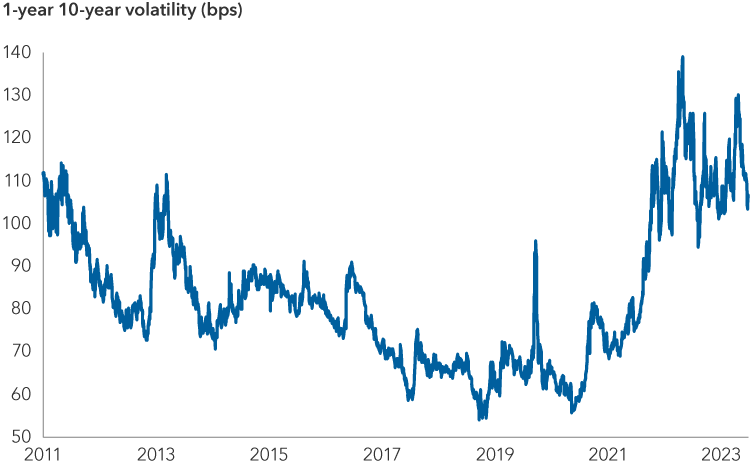
Source: Bloomberg. Data as of December 22, 2023.
4. A mixed risk/reward outlook across plus sectors
High-yield bonds currently have an appealing starting yield of around 7.7% and could perform well in a strong economy. However, it is also a shorter duration asset class (the Bloomberg U.S. Corporate High Yield Index today has about 3 years of duration compared to around 7 years for the Bloomberg U.S. Corporate Investment Grade Index), meaning it will not benefit as much from price appreciation if rates fall as expected in 2024. On the whole, the high-yield sector seems to offer a similar upside to investment-grade corporates, but high yield has the potential to do a lot worse in a risk-off environment.
Emerging market debt (EMD), on the other hand, may have a much more attractive outlook. The sector is typically limited in core portfolios because the EMD in core bond indices such as the Bloomberg U.S. Aggregate Index only contain a small fraction of the broader asset class — but the sector may offer compelling opportunities for investors seeking to add additional yield and total return in 2024. Growth outside the U.S. could present a challenge, but investors are largely being well compensated for that risk at current valuations. Emerging market currencies could also fare well and support the asset class if the dollar bull market begins to reverse when the Fed cuts interest rates.
5. Strong demand should support bonds in 2024
I believe investors are going to shift an increasing amount of money to fixed income and more interest rate-sensitive assets in 2024 as the Fed has signaled an end to its hiking cycle. Many who left the bond market when yields were rising should return to lock in today’s higher yields. The Bloomberg U.S. Aggregate Index currently has a yield of around 4.6%.
In my central scenario, an investor who moves their cash allocation to core bonds will increase their potential total return while simultaneously decreasing the risk of their overall portfolio given the historically greater resilience of bonds in an economic shock or recession. It’s rare for one trade to both increase return and decrease risk, but that highlights why I believe there is such a great opportunity to shift assets to bonds today.
I expect investors who viewed cash as attractive (given higher yields and an inverted yield curve) are beginning to realize that those cash yields are likely to fall quickly as the Fed cuts rates – potentially as soon as March per current market pricing. Although, cash yields (as represented by short term government bonds) appears to be around 5.2% today, I expect the actual yield for an investor holding through the Fed cuts in 2024 will be less than 4.7%, which is almost the same as the current 4.6% yield of the Bloomberg U.S. Aggregate Index. And many active core bond funds may have a yield even greater than that.
A window of opportunity for moving cash off the sidelines?
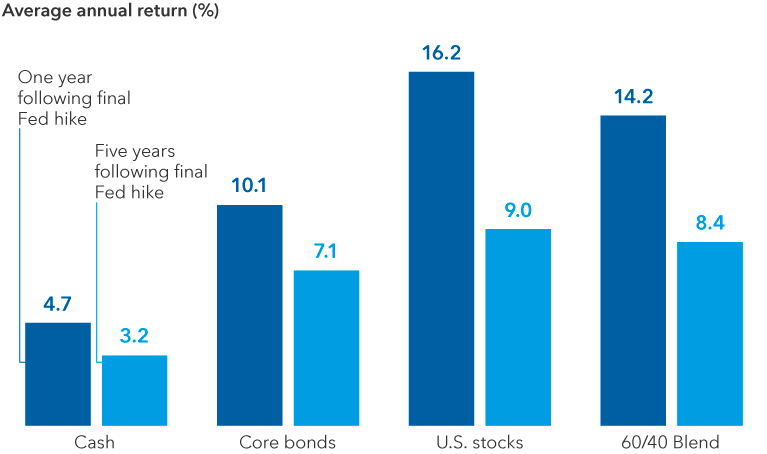
Sources: Capital Group, Morningstar. Chart represents the average returns across respective sector proxies in a forward extending window starting in the month of the last Fed hike in the last four transition cycles from 1995 to 2018 with data through June 30, 2023. Benchmarks represent the U.S. 3-month T-bill (cash), Bloomberg U.S. Aggregate Index (core bonds), S&P 500 Index (U.S. stocks) and a blend of 60% of the S&P 500 Index & 40% of the Bloomberg U.S. Aggregate Index (60/40 blend). Past results are not predictive of future periods.
While cash may offer similar yield to a core bond portfolio, it loses out on the price appreciation that occurs when interest rates fall. As I highlighted earlier, every 50-bps decline in yields should lead to an additional 3% total return in a core bond portfolio (with duration around 6 years), and potentially even more with an actively managed fund.
In a recession scenario where the Fed cuts rates more aggressively, the total return for cash will go down even more, while the total return for a core bond fund should go up significantly.
The bottom line: Now may be the time for core bonds
If inflation and interest rates come down as expected, it should support stocks and bonds alike. The positive correlations that hurt investors in 2022 should work in investors' favor in 2024. And if growth falters once inflation is back close to 2%, bonds can offer more of the typical resilience investors have come to expect in an equity market downturn. I believe core bonds may offer more diversification than they have in a decade because higher starting yields mean bonds have a lot more room to rally if risk assets are challenged.
To be sure, there are risks to this outlook, such as a re-acceleration in growth that leads to a re-acceleration of inflation. I believe this is a lower probability scenario, but one to watch out for as financial conditions ease. Potential external shocks, including geopolitical events, are always present as well – 2024 is an election year.
Overall, the prospects for fixed income look bright. With income higher and diversification potential greater than it’s been in a decade, along with a very attractive risk-reward profile, the time to own bonds is now.
The value of fixed income securities may be affected by changing interest rates and changes in credit ratings of the securities.
You could lose money by investing in a money market fund. Although money market funds seek to preserve the value of your investment at $1.00 per share, they cannot guarantee it will do so. An investment in a money market fund is not insured or guaranteed by the Federal Deposit Insurance Corporation or any other government agency. The fund’s sponsor has no legal obligation to provide financial support to the fund, and you should not expect that the sponsor will provide financial support to the fund at any time. Past results are not predictive of results in future periods.
Bloomberg U.S. Aggregate Index represents the U.S. investment-grade fixed-rate bond market. This index is unmanaged, and its results include reinvested dividends and/or distributions but do not reflect the effect of sales charges, commissions, account fees, expenses or U.S. federal income taxes.
Bloomberg U.S. Corporate Investment Grade Index represents the universe of investment grade, publicly issued U.S. corporate and specified foreign debentures and secured notes that meet the specified maturity, liquidity and quality requirements. This index is unmanaged, and its results include reinvested distributions but do not reflect the effect of sales charges, commissions, account fees, expenses or U.S. federal income taxes.
Bloomberg U.S. Corporate High Yield Index covers the universe of fixed-rate, non-investment-grade debt. This index is unmanaged, and its results include reinvested distributions but do not reflect the effect of sales charges, commissions, account fees, expenses or U.S. federal income taxes.
Cash equivalents – Securities that are intended for short-term investing. Normally, they have solid credit quality and are highly liquid. They are considered equivalent to cash because they can be converted to actual cash quickly.
The Consumer Price Index (CPI) is a measure of the average change over time in the prices paid by urban consumers for a market basket of consumer goods and services.
Credit spread - A credit spread is the difference in yield (the expected return on an investment over a particular period of time) between a government bond and another debt security of the same maturity but with different credit quality.
Duration measures a bond’s sensitivity to changes in interest rates. Generally speaking, a bond's price will go up 1% for every year of duration if interest rates fall by 1% or down 1% for every year of duration if interest rates rise by 1%.
Inflation – The rise in the prices of goods and services, as happens when spending increases relative to the supply of goods on the market – in other words, too much money chasing too few goods. Core inflation metrics strip out volatile items like food and energy.
Interest coverage – a measure of a corporate bond issuer’s ability to pay the interest on its outstanding debt.
Issuer – A legal entity that develops, registers and sells securities to finance its operations. Issuers may be corporations, investment trusts, or governments.
Liquidity – Liquidity describes the degree to which an asset or security can be quickly converted into cash without a significant concession in price.
Personal Consumption Expenditures (PCE) – A measure of the prices that people living in the United States, or those buying on their behalf, pay for goods and services. The PCE price index is known for capturing inflation (or deflation) across a wide range of consumer expenses and reflecting changes in consumer behavior.
Risk-off environment - when investors become more cautious due to an unforeseen event or data point and riskier investments such as equities and credit selloff.
Our latest insights
-
-
Interest Rates
-
-
Municipal Bonds
-
Artificial Intelligence
RELATED INSIGHTS
Never miss an insight
The Capital Ideas newsletter delivers weekly investment insights straight to your inbox.