Portfolio Construction
Categories
ETF
The biggest trends for active ETFs in 2023
 Mark Barile
November 13, 2023
Exchange-traded funds (ETFs) were historically associated with passive strategies. But regulatory changes in 2019 made it easier for managers to introduce and oversee active ETFs. This led to a proliferation of active strategies packaged in a tax-efficient ETF wrapper. (The way ETF shares are created and redeemed can help limit capital gains distributions.) Four years later, 2023 may go down as the year that active ETF inflows really started to take off.
If you’re considering using active ETFs, you may have questions about their maturity. We break down some of the biggest trends in active ETFs and what advisors should watch going forward.
KEY TAKEAWAYS
- Active ETFs represent about 6% of U.S. ETF assets but have accounted for nearly a quarter of inflows so far in 2023.
- Passive and active ETFs have different considerations and features, and some advisors use a mix of both when constructing portfolios.
- Advisors may use active ETFs more in the future due to growing comfort with the vehicle and more active managers making their strategies available through ETFs.
ETFs were historically associated with passive strategies. But regulatory changes in 2019 made it easier for managers to introduce and oversee active ETFs. This led to a proliferation of active strategies packaged in a tax-efficient ETF wrapper. (The way ETF shares are created and redeemed can help limit capital gains distributions.) Four years later, 2023 may go down as the year that active ETF inflows really started to take off.
If you’re considering using active ETFs, you may have questions about their maturity. We break down some of the biggest trends in active ETFs and what advisors should watch going forward.
Active ETFs earned nearly a quarter of 2023 flows
Passively managed ETFs have a much longer history and, therefore, most of the assets. Active ETFs account for about 6% of the roughly $7.2 trillion overall U.S. ETF market.1 But active ETF assets have risen 44% year-over-year to $439 billion despite a volatile market environment.1
It’s the organic growth trends of active and passive ETFs, however, that jump off the page. Active ETFs have accounted for about 24% of all ETF flows year to date.1 The trend gained momentum in September, as active ETFs brought in $11 billion, seeing their best month of inflows this year.1
“Active ETFs represent just 6% of total assets, but about 24% of year-to-date flows.”
More choice and managers in active ETFs
Some advisors may be interested in active strategies for specific asset classes, but their preferred active managers may not offer those strategies as ETFs. That could change, though, as more asset managers launch their first active ETFs in response to demand from investors and advisors.
For example, in the U.S. equity category, active ETFs have attracted inflows of $21.5 billion year to date.1 Capital Group has already established itself as a competitive active ETF manager despite entering the space relatively recently in February 2022.2
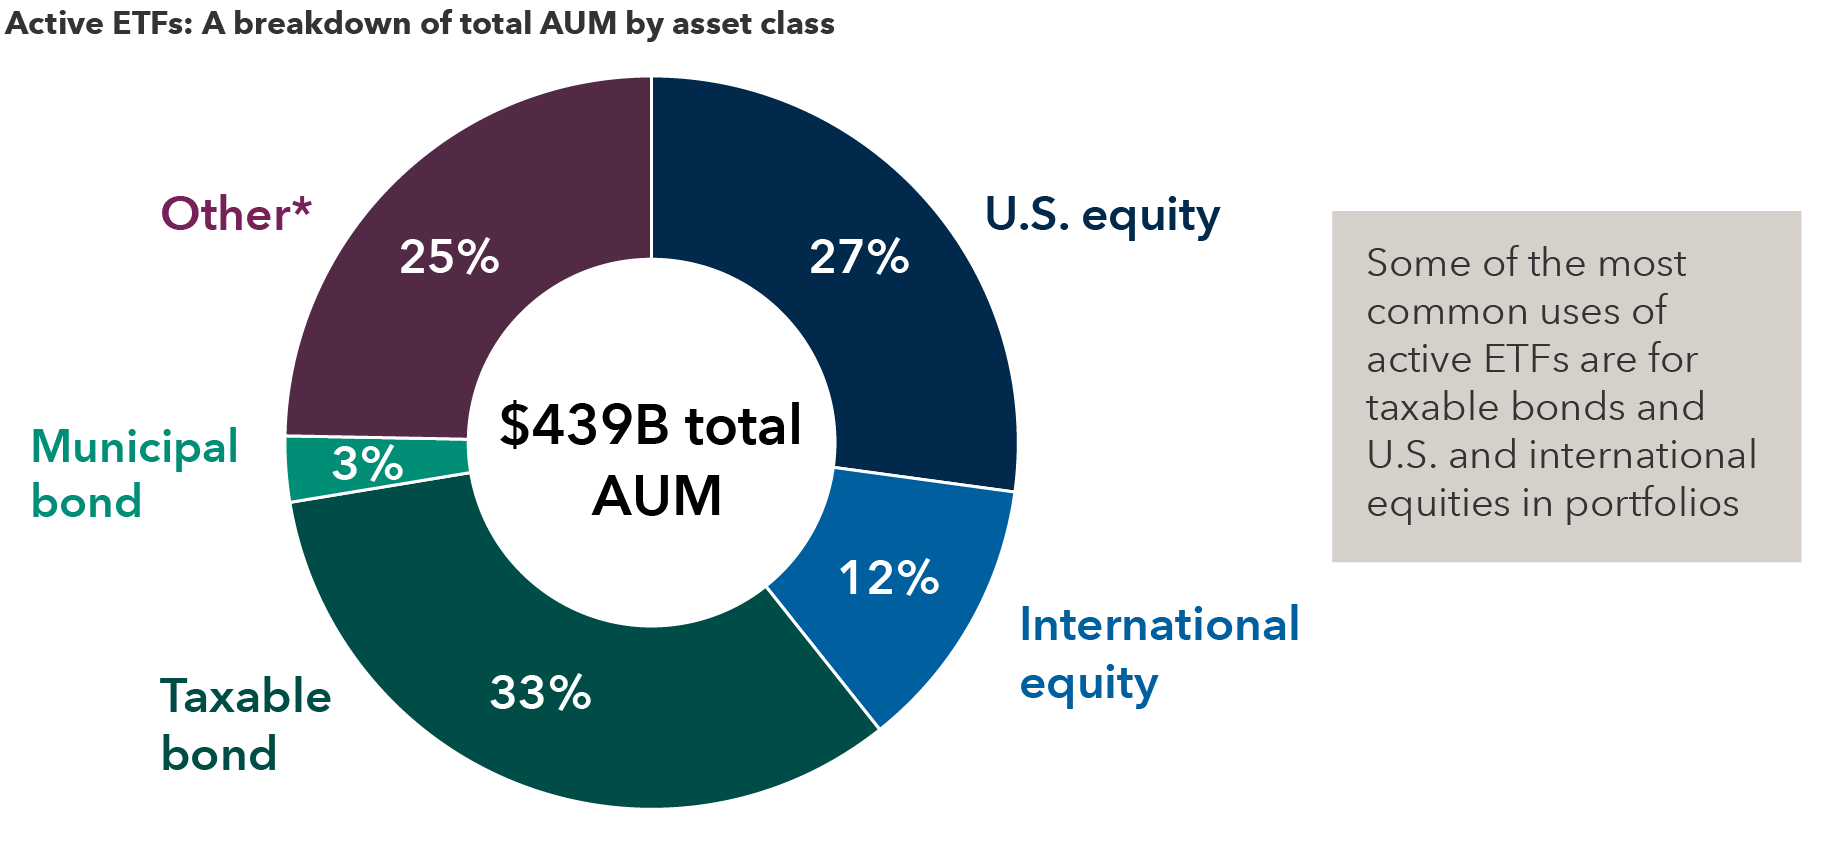
*”Other” includes Commodities, Alternatives, Allocation, Nontraditional Equity, Sector Equity and Miscellaneous.
Source: Morningstar Direct, as of September 30, 2023.
What’s driving the interest in active equity ETFs? The benefits of the ETF structure, including tax efficiency and portfolio transparency, definitely contribute. More advisors may also be turning to actively managed strategies in the face of market volatility and the potential impact of rising inflation and interest rates on corporate profits. Meanwhile, more active managers are offering their strategies in the ETF vehicle that some advisors prefer.
Finally, the concentration issues in popular market-capitalization-weighted indexes have raised questions about the diversification of core passive equity ETFs. For example, the S&P 500 Index has about 32% in the top 10 stocks alone.3
Looking ahead, it appears advisors will have more options to select from in active ETFs. In 2022, there were 454 new ETFs launched and 64% of them active.1 Active launches in 2023 are already on pace to top that figure, with active representing three quarters of all ETF launches so far.1
Comparing passive and active ETFs
Key differences when considering index-tracking and actively managed ETFs
Passive ETFs
Aim to track the risk/return profile of an index. Indexes may be broad or niche (such as those offering exposure to specific countries or sectors). The ETF may do this by mirroring holdings or by selecting a subset of holdings that seek to produce a similar risk/return outcome.
FEATURES AND CONSIDERATIONS
- Fully transparent holdings
- Rebalancing occurs on a set schedule
- Restricted to holdings that follow the rules of the underlying index
- Typically no ability to provide a measure of protection against market volatility so investors are “along for the ride” when markets ebb and flow
Active ETFs
Feature active management, which means a manager (or team) selects fund holdings using an investment strategy, to pursue better-than-market outcomes for investors.
FEATURES AND CONSIDERATIONS
- Opportunity for better-than-market returns
- Capacity to pursue investments that can provide better downside risk than the market
- Ability to express a particular investment objective
- Flexibility to allow the manager to rebalance anytime during the trading day
- May lag their benchmark index
Advisors combine active and passive strategies
Some advisors use a mix of active and passive funds based on the particular asset class and the selection of ETFs currently available.
For the last several years, Capital Group’s Portfolio Consulting and Analytics team has worked with thousands of financial advisors on building investment portfolios. During this time, in the portfolios the team has analyzed, the amount of actively managed investments has remained consistently near 70%, with passive occupying approximately 30% of portfolios. For RIA portfolios specifically, that balance has hovered at 60% active and 40% passive.
In general, I believe advisors tend to prefer active strategies because of the ability to align portfolios with investment objectives such as preserving capital, generating income, and capital appreciation. Oftentimes, the use of passive is partially rooted in the benefits of the ETF vehicle, including lower costs, tax efficiency and transparency.
With more well-known active managers offering their equity and fixed income strategies in the ETF vehicle, we are eager to see how this impacts portfolio construction decisions by advisors.
Our suite of actively managed ETFs is growing. We recently introduced five new actively managed ETFs, including Capital Group’s first-ever multi-asset ETF.
1 Source: Morningstar Direct, as of September 30, 2023.
2 “8 Observations on ETF Flows in August,” Morningstar.com, September 1, 2023.
3 Source: S&P Dow Jones Indices, as of September 30, 2023.
Learn more about
To read the full article, become an RIA Insider. You'll also gain complimentary access to news, insights, tools and more.
Already an Insider?
Investments are not FDIC-insured, nor are they deposits of or guaranteed by a bank or any other entity, so they may lose value.
Investors should carefully consider investment objectives, risks, charges and expenses.
This and other important information is contained in the fund prospectuses and summary prospectuses, which can be obtained from a financial professional and should be read carefully before investing.
Statements attributed to an individual represent the opinions of that individual as of the date published and do not necessarily reflect the opinions of Capital Group or its affiliates. This information is intended to highlight issues and should not be considered advice, an endorsement or a recommendation.
All Capital Group trademarks mentioned are owned by The Capital Group Companies, Inc., an affiliated company or fund. All other company and product names mentioned are the property of their respective companies.
Use of this website is intended for U.S. residents only.
American Funds Distributors, Inc.
This content, developed by Capital Group, home of American Funds, should not be used as a primary basis for investment decisions and is not intended to serve as impartial investment or fiduciary advice.
© 2023 Morningstar, Inc. All Rights Reserved. Some of the information contained herein: (1) is proprietary to Morningstar and/or its content providers; (2) may not be copied or distributed; and (3) is not warranted to be accurate, complete or timely. Neither Morningstar, its content providers nor Capital Group are responsible for any damages or losses arising from any use of this information. Past performance is no guarantee of future results. Information is calculated by Morningstar. Due to differing calculation methods, the figures shown here may differ from those calculated by Capital Group.
Each S&P Index ("Index") shown is a product of S&P Dow Jones Indices LLC and/or its affiliates and has been licensed for use by Capital Group. Copyright © 2023 S&P Dow Jones Indices LLC, a division of S&P Global, and/or its affiliates. All rights reserved. Redistribution or reproduction in whole or in part is prohibited without written permission of S&P Dow Jones Indices LLC.
For financial professionals only. Not for use with the public.