Interest Rates
Categories
Investing Strategy
2024 Outlook: 6 themes to guide your client conversations
Last year was especially volatile for both equity and bond markets. Heading into 2024, it’s difficult to remember another time when the outlook was so uncertain. Recession or expansion? Higher or lower interest rates? Inflation or deflation? More or less geopolitical tension? You can find evidence for or against most every scenario. In this environment, where should investors turn?
For some investors, macroeconomic headwinds may be a distraction and delay decision making. While the macro picture may remain blurry for some time, Capital Group’s investment team will continue to seek companies that are well positioned for the long run and possess competitive and comparative advantages.
KEY TAKEAWAYS
- Investors who moved into cash out of caution may now want to reconsider. Historically, the end of a rate-tightening cycle has been a good time to redeploy cash into stocks and bonds.
- Higher-for-longer interest rates do not have to mean lower returns. Over the past 50 years, both stock and bond markets have performed strongly with 10-year yields at current levels.
- The 2024 U.S. elections will likely make little real difference to investors. Past evidence has shown that equity returns are much the same in the decade following a presidential election, no matter which party wins.
Last year was especially volatile for both equity and bond markets. Heading into 2024, it’s difficult to remember another time when the outlook was so uncertain. Recession or expansion? Higher or lower interest rates? Inflation or deflation? More or less geopolitical tension? You can find evidence for or against most every scenario. In this environment, where should RIAs help their clients find opportunities?
For some investors, macroeconomic headwinds may be a distraction and delay decision making. While the macro picture may remain blurry for some time, Capital Group’s investment team will continue to seek companies that are well positioned for the long run and possess competitive and comparative advantages.
To help you prepare for conversations with your clients about current investment risks and opportunities, we highlight six key themes from Capital Group’s 2024 Outlook report, along with talking points and visuals. You can also find deeper dives on our 2024 economic outlook, stock market outlook and bond outlook.
1. Cash on the sidelines can be a bullish signal
Your clients may have been part of the investor exodus from stock and bond markets into cash over the last few years. This caution is understandable, especially in the rate-rising and inflation-fighting phase of the cycle, but those who are still on the sidelines may miss out on a historic window of opportunity.
With inflation easing, the U.S. Federal Reserve (the “Fed”) has signaled it may be near the end of its tightening cycle. Historically, this has provided a favorable time for investors to redeploy cash into stock and bond investments.
S&P 500 typically performs well following cash peaks
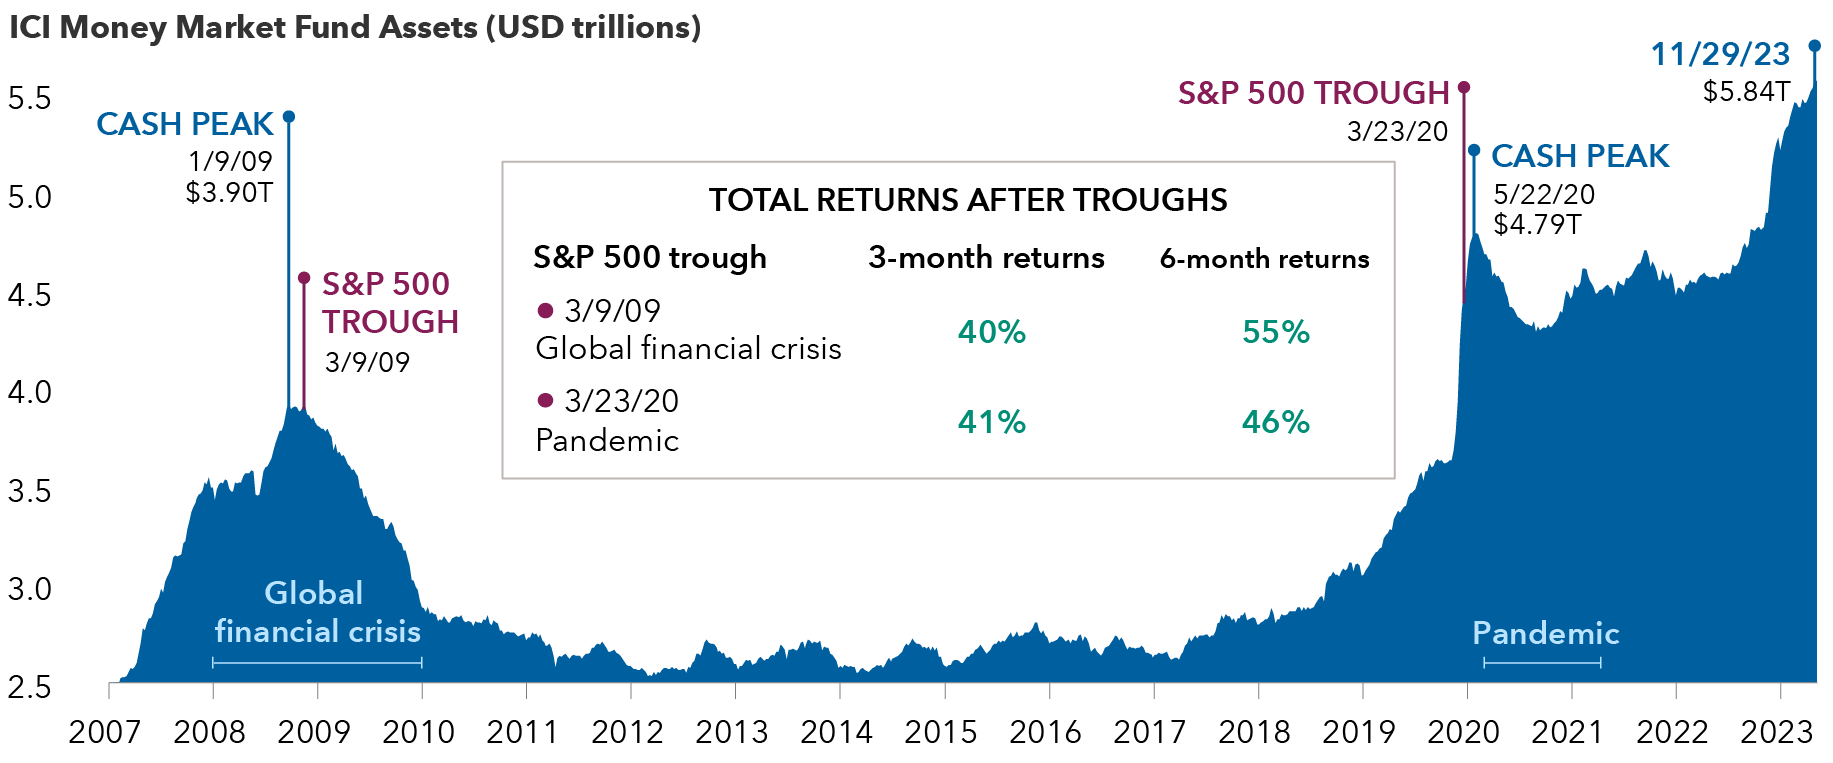
Sources: Capital Group, Investment Company Institute (ICI), Standard & Poor’s. "Cash peak” refers to peak levels of assets held in U.S. money market funds as reported by the ICI. S&P troughs reflect the date of the lowest value in the S&P 500 Index before a subsequent recovery. You could lose money by investing in a money market fund. Although money market funds seek to preserve the value of your investment at $1.00 per share, they cannot guarantee they will do so. An investment in a money market fund is not insured or guaranteed by the Federal Deposit Insurance Corporation or any other government agency. The fund’s sponsor has no legal obligation to provide financial support to the fund, and you should not expect that the sponsor will provide financial support to the fund at any time. As of November 29, 2023. Past results are not predictive of results in future periods.
Following the last four tightening cycles, stocks, bonds and the 60/40 stock/bond portfolio sharply outpaced returns on three-month U.S. Treasury bills in the first year after the final Fed interest rate hike. Conversely, the three-month U.S. Treasury yield, a proxy for cash-equivalent investments, rapidly declined an average of 2.5% in the 18 months after the final Fed hike.1
“I believe we’re on the cusp of a major transition where long-term investors can find attractive investment opportunities in stocks and bonds,” says Mike Gitlin, president and chief executive officer of Capital Group.
Stocks and bonds have historically outpaced cash after Fed hikes ended
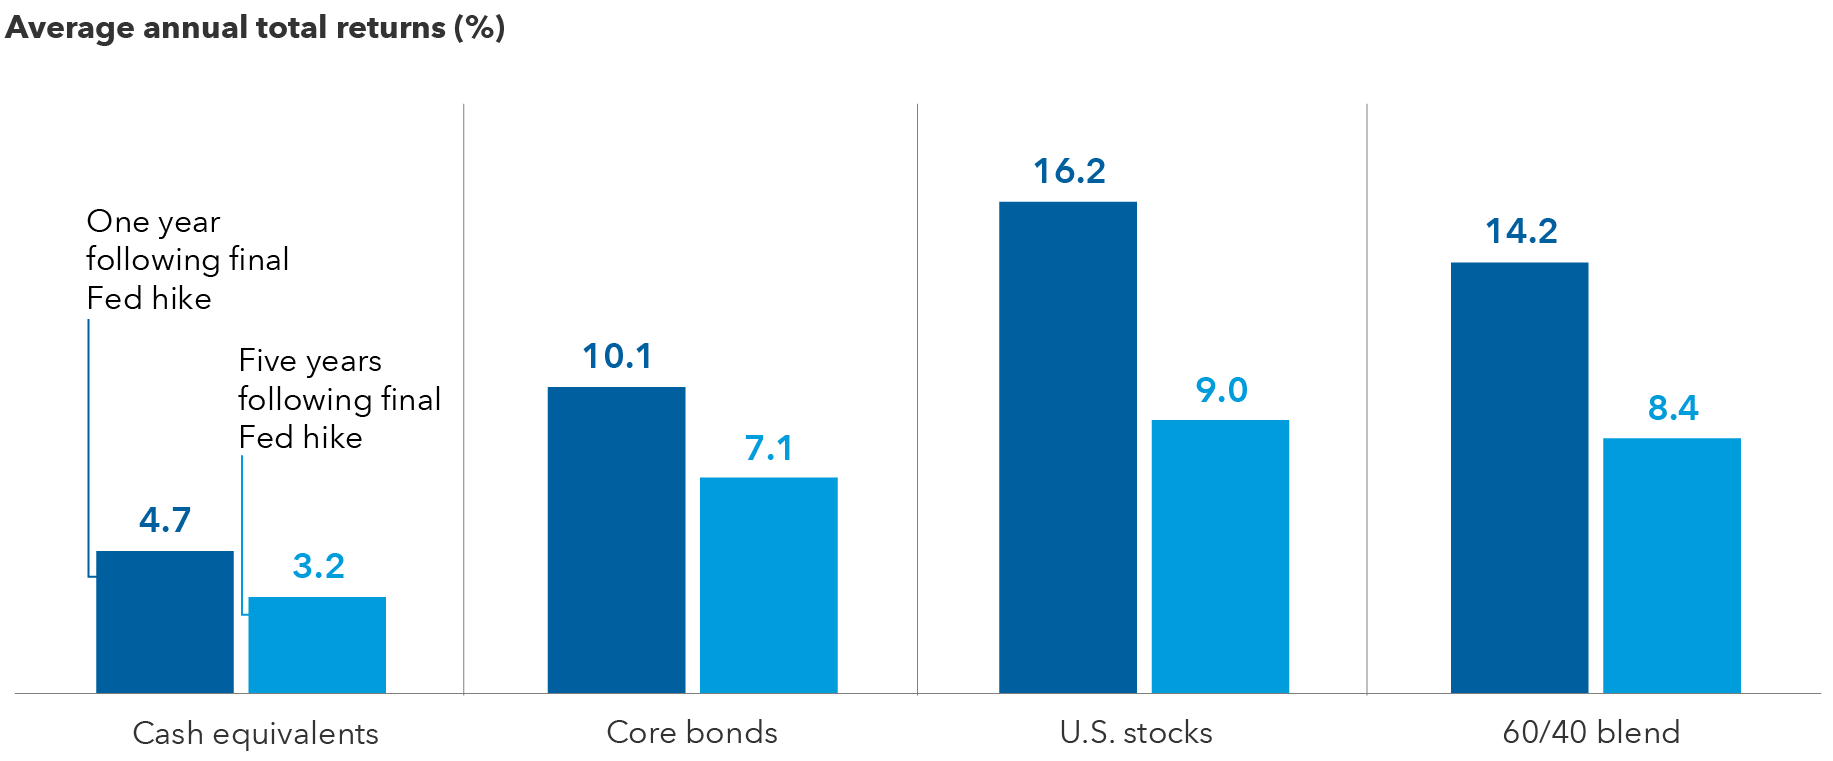
Sources: Capital Group, Morningstar. Chart represents the average returns across respective sector proxies in a forward extending window starting in the month of the last Fed hike in the last four transition cycles from 1995 to 2018 with data through June 30, 2023. Benchmarks represent U.S. 3-month Treasury-bill (cash equivalents), Bloomberg U.S. Aggregate Index (core bonds), S&P 500 Index (U.S. stocks) and a blend of the 60% S&P 500 Index and 40% Bloomberg U.S. Aggregate Index (60/40 blend). Long-term averages represented by the average five-year annualized rolling returns from 1995. Past results are not predictive of results in future periods.
2. Higher interest rates don’t necessarily mean lower returns
Your clients may need to get used to rates being higher for longer, but that doesn’t necessarily mean their long-term returns will suffer.
Historical evidence suggests that investors eventually adjust and stocks and bonds tend to outperform when interest rates are in the 4.0%–6.0% range (relative to other interest rate eras). Since 1976, when 10-year yields have been in the 4.0%–6.0% range as they are now, the median annualized return for the S&P 500 Index was 14.2%, and the median annualized return for the Bloomberg U.S. Aggregate Index (bond market) was 6.99%.2
Looking ahead in 2024, Capital Group fixed income portfolio manager Pramod Atluri believes yields may remain at levels considered normal prior to the global financial crisis, and then hover in the 3.5%–5.5% range. However, Atluri is optimistic that consumers will continue to carry the economy, even if rates remain higher for longer, due to wages and home values being above pre-pandemic levels and the long tail of Fed deficit spending in recent years.
For investors, higher interest rates put the “income” back into fixed income. These rates may also signal a return to bonds acting as effective diversifiers for equities and the resurgence of the 60/40 stock/bond portfolio after many pundits sounded its death knell recently.
Long-term U.S. rates are back within historical norms
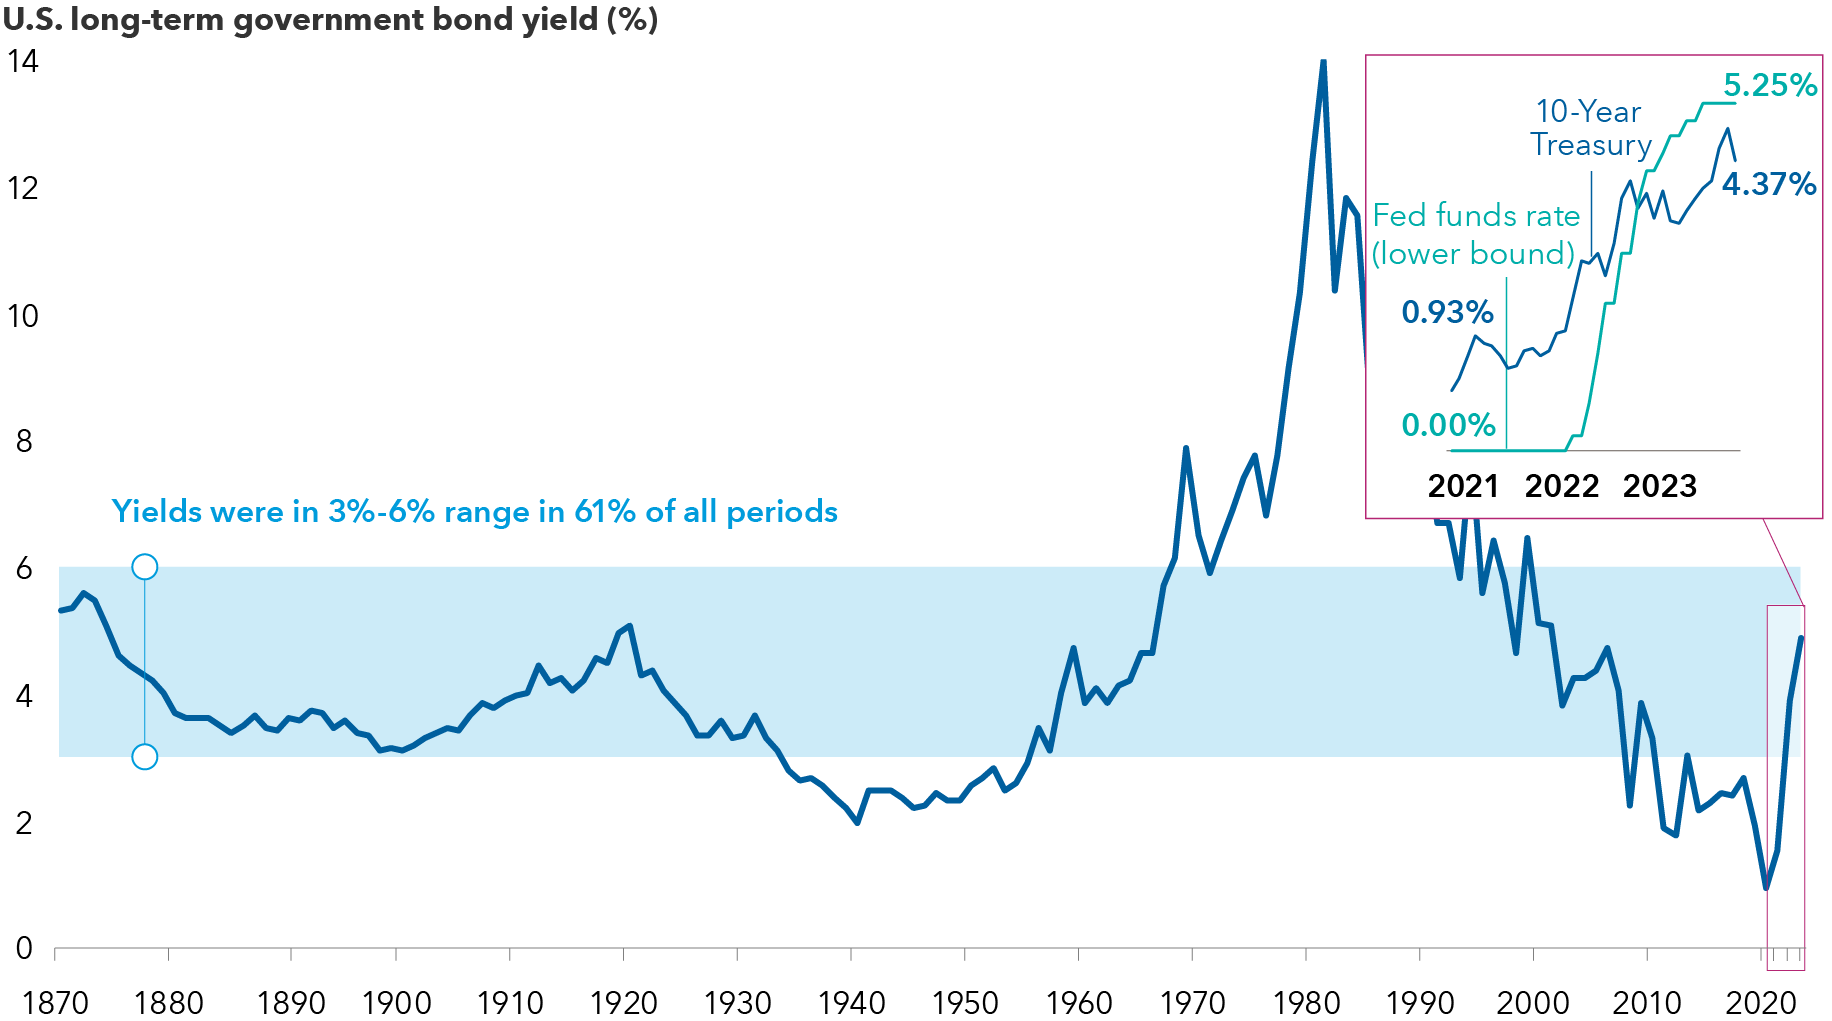
Sources: Federal Reserve, Robert Shiller. Data for 1871–1961 represents average monthly U.S. long-term government bond yields compiled by Robert Shiller. Data for 1962–2022 represents 10-year Treasury yields, as of December 31 each year within the period. Data for 2023 is as of November 30, 2023. Past results are not predictive of results in future periods.
3. The outcome of the 2024 U.S. elections will likely make little difference to investors
Markets can be volatile in election years, and your clients may be uncertain about how a potential change in political leadership could affect returns.
The good news is that historically it makes little difference to investors which political party takes the White House. Since 1936, the 10-year annualized return of an investment in the S&P 500 Index made at the start of an election year was 11.2% when a Democrat won and 10.5% when a Republican won.
Capital Group equity portfolio manager Rob Lovelace, who has invested through many election cycles in his 37-year career, believes the added uncertainty of an election year can provide attractive investment opportunities. “When everyone is worried that a new government policy is going to hurt a sector, that concern is often overblown,” he says. “High-quality companies can sometimes get caught in political crosshairs, which can create a buying opportunity.”
“Blue” and “red” returns look much the same
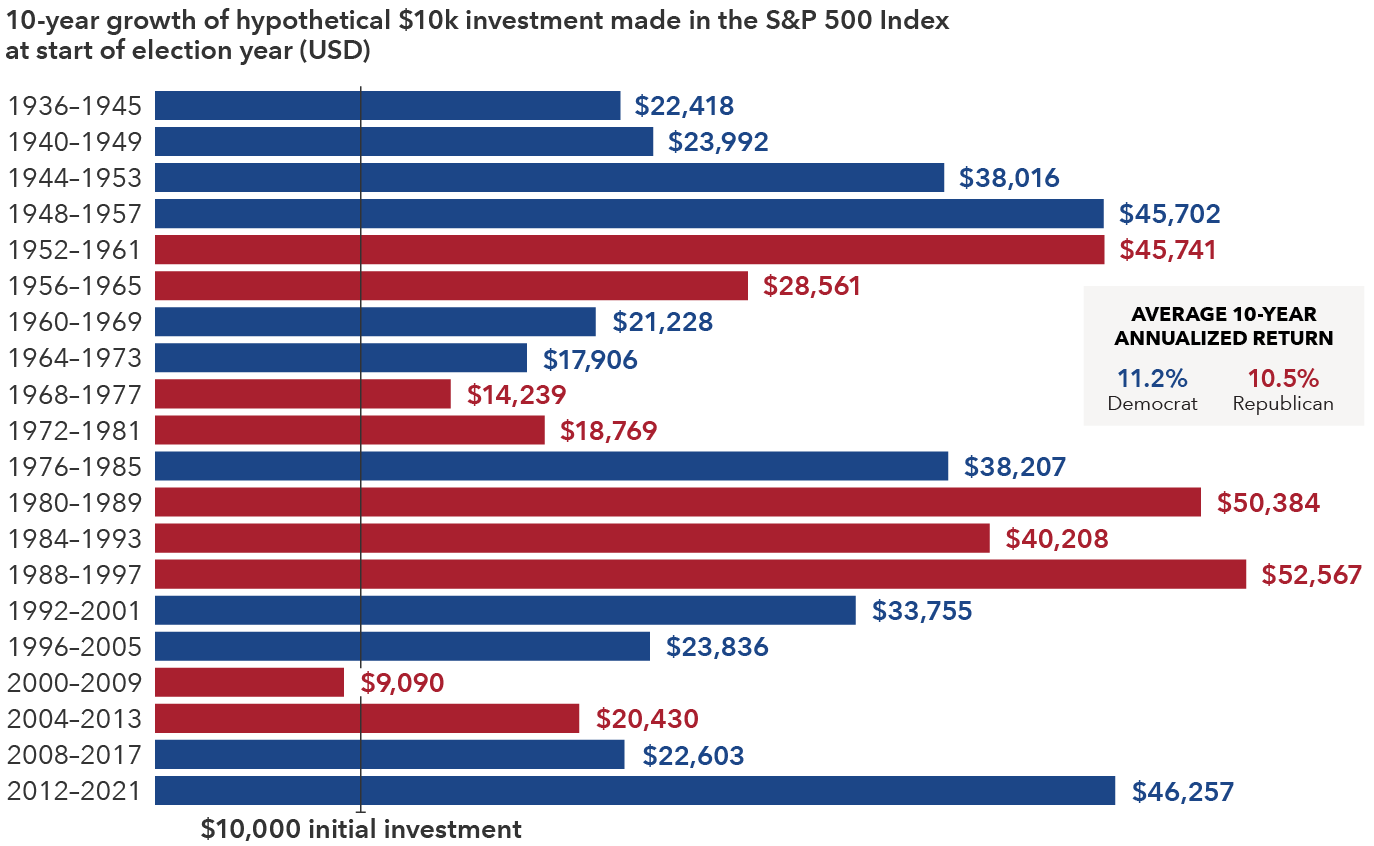
Sources: Capital Group, Standard & Poor’s. Each 10-year period begins on January 1 of the first year shown and ends on December 31 of the tenth year. For example, the first period listed (1936) covers January 1, 1936, to December 31, 1945. Figures shown are past results and are not predictive of results in future periods.
4. A “rolling recession” could make a broad downturn less likely
There is good news for your clients who may be concerned about a potential U.S. recession.
Many pundits predicted a recession in 2023, and they may not have been entirely wrong. The recession did happen, just not all at once. Economic data show that over the past 18 months, different sectors experienced downturns and recoveries at different times. Economists call this a “rolling recession.”
For example, residential housing contracted sharply after the Fed started raising interest rates in 2022. Existing home sales tumbled nearly 40% at one point, but now there are signs that the housing market is recovering.3
These rare, rolling recessions may reduce the probability of a broad downturn in 2024 or beyond despite the burdens of high inflation and high interest rates.
If the contractions and recoveries continue in various parts of the economy and the consumer remains reasonably strong, the U.S. could avoid the most widely predicted general recession in history, says Capital Group economist Jared Franz.
Equity portfolio manager Chris Buchbinder agrees: “This has been Godot’s recession — we’ve all been waiting for it. But in my view, the probability of a severe downturn is now well below 50%.”
Mini recessions have rolled across different industries
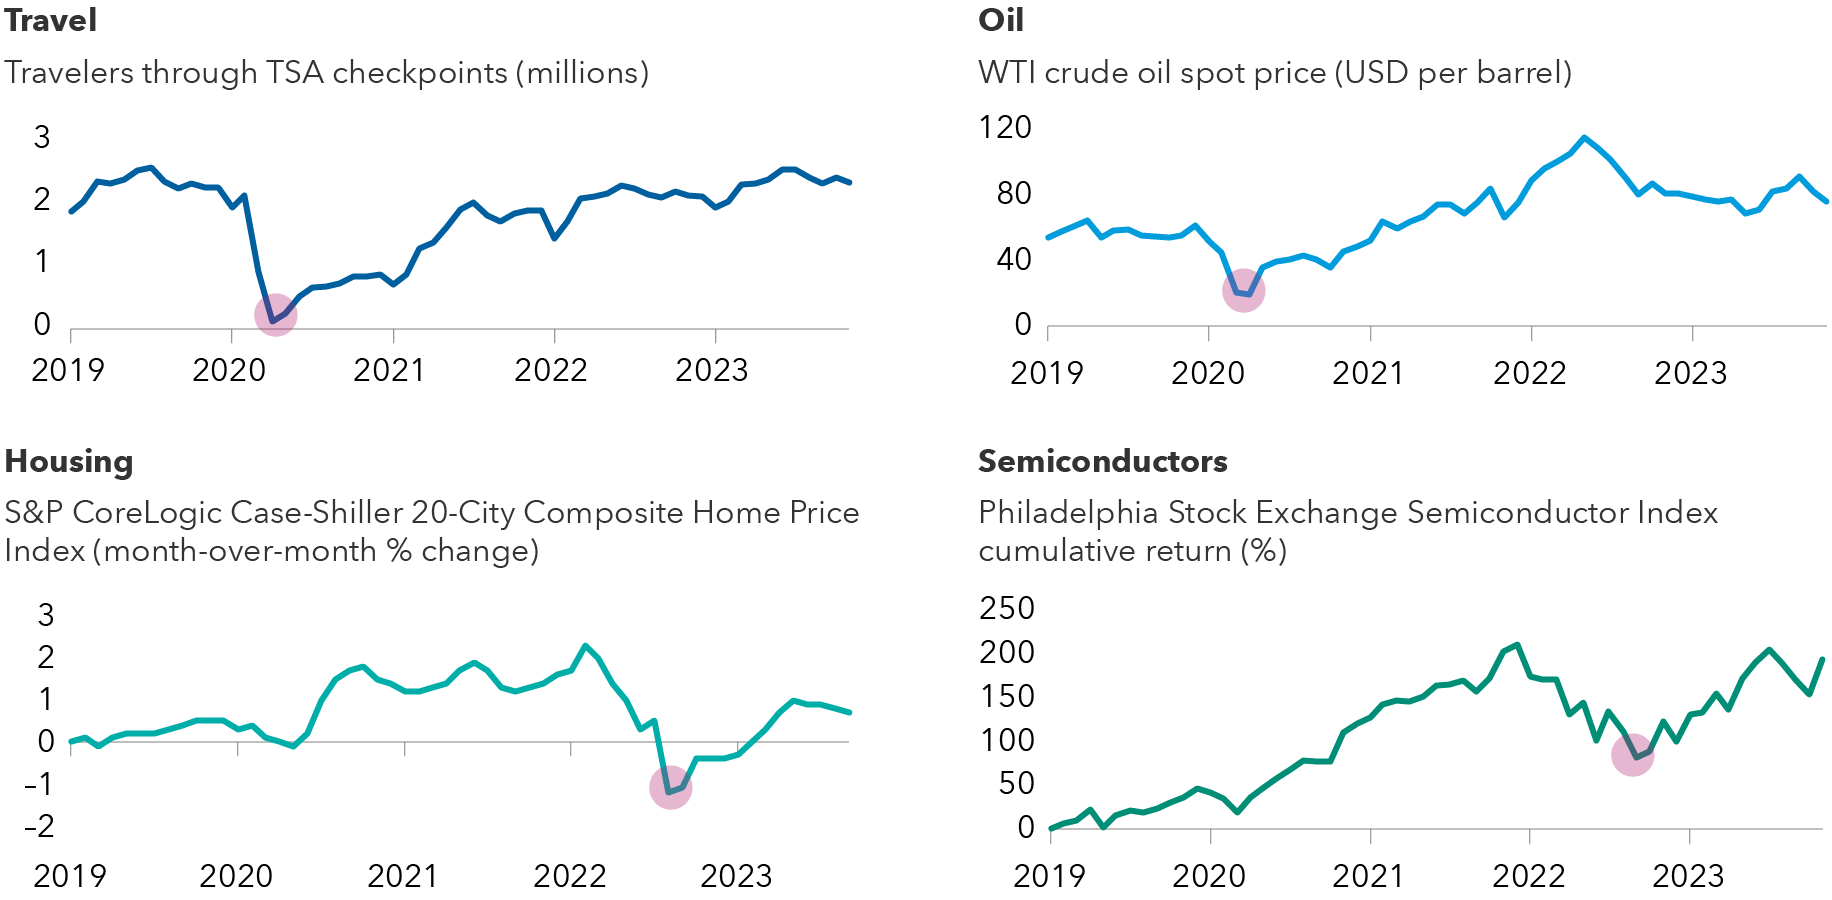
Sources: Travel: Transportation Security Agency (TSA), U.S. Department of Homeland Security. Data is a 30-day moving average. As of November 30, 2023. Oil: Refinitiv. As of November 30, 2023. Housing: Standard & Poor’s. Latest available monthly data is September 2023, as of November 30, 2023. Semiconductors: Philadelphia Stock Exchange. As of November 30, 2023. Data represent cumulative price return since January 1, 2019. Past results are not predictive of results in future periods.
5. Rising corporate earnings should support equity returns in 2024
With rich price-to-earnings (P/E) multiples on U.S. stock indexes, your clients may be concerned about the potential for equity returns in 2024.
If high interest rates persist, as many analysts now expect, it may be difficult for P/E multiples to expand. However, when it comes to stock prices, one of the metrics that matters most is corporate earnings. Rising earnings can support stock valuations when multiples are static.
Luckily, most analysts expect earnings to rebound in 2024. The consensus is for S&P 500 Index company earnings to rise more than 11%, along with an expected 6.1% earnings boost in international markets, and a robust 18% earnings gain in emerging markets (based on consensus data compiled by FactSet).
Do these consensus expectations seem too high? “I think we’re more likely to see 6% to 8% growth in the U.S.,” says Franz, “and potentially higher in some emerging markets.”
While higher corporate earnings could provide a runway for stocks, it is important to be mindful of risks that could hamper earnings growth. These risks include sluggish consumer spending in the face of persistent inflation, slowing economic growth in Europe and China and ongoing geopolitical tensions.
Solid earnings growth expected across major markets …
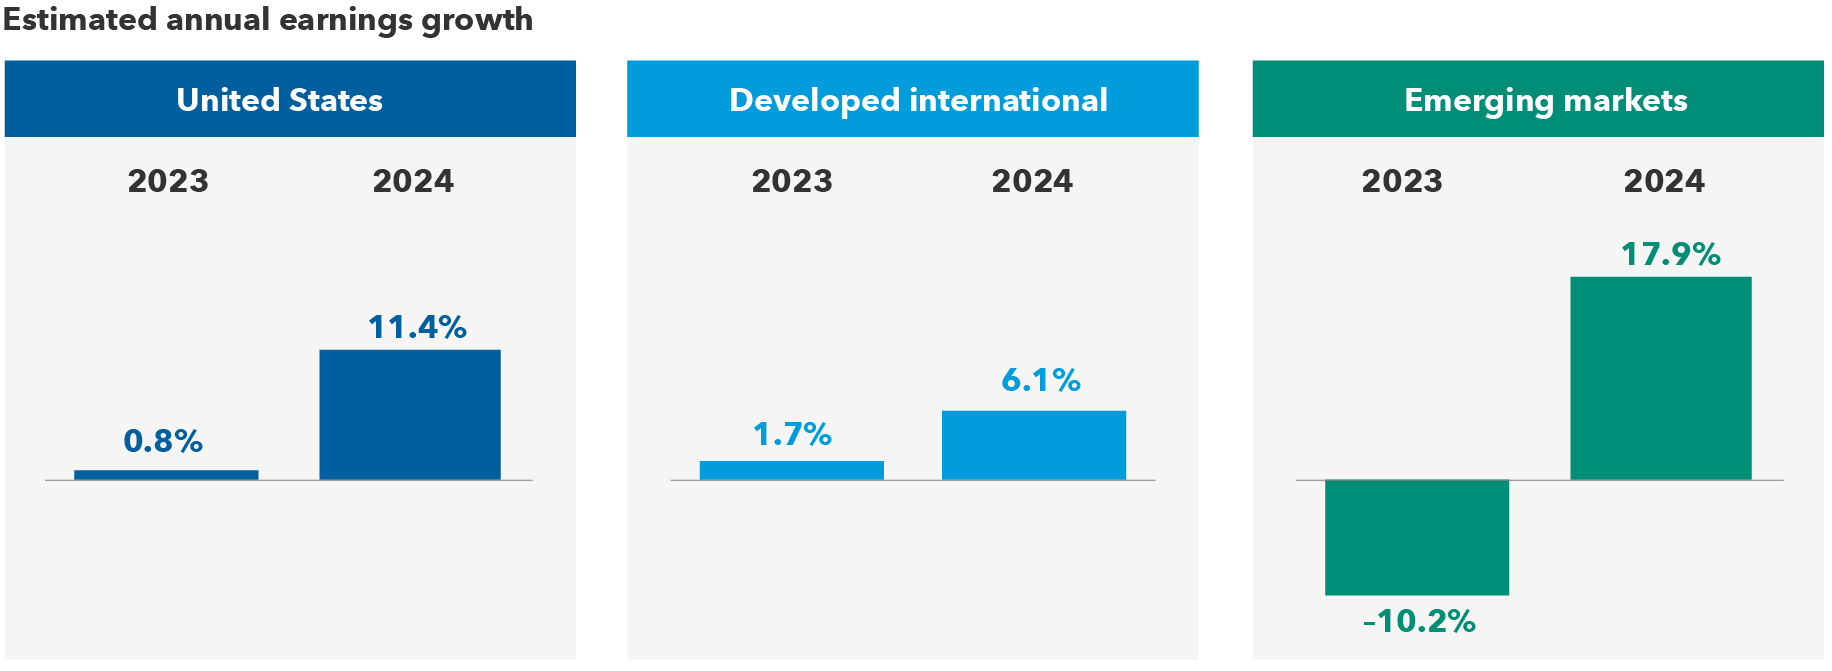
Sources: Capital Group, FactSet, MSCI, Standard & Poor’s. Estimated annual earnings growth is represented by the mean consensus earnings per share estimates for the years ending December 2023 and December 2024, respectively, across the S&P 500 Index (U.S.), MSCI EAFE Index (developed international) and MSCI Emerging Markets Index (emerging markets). Estimates are as of November 30, 2023.
… But economic indicators offer a mixed outlook
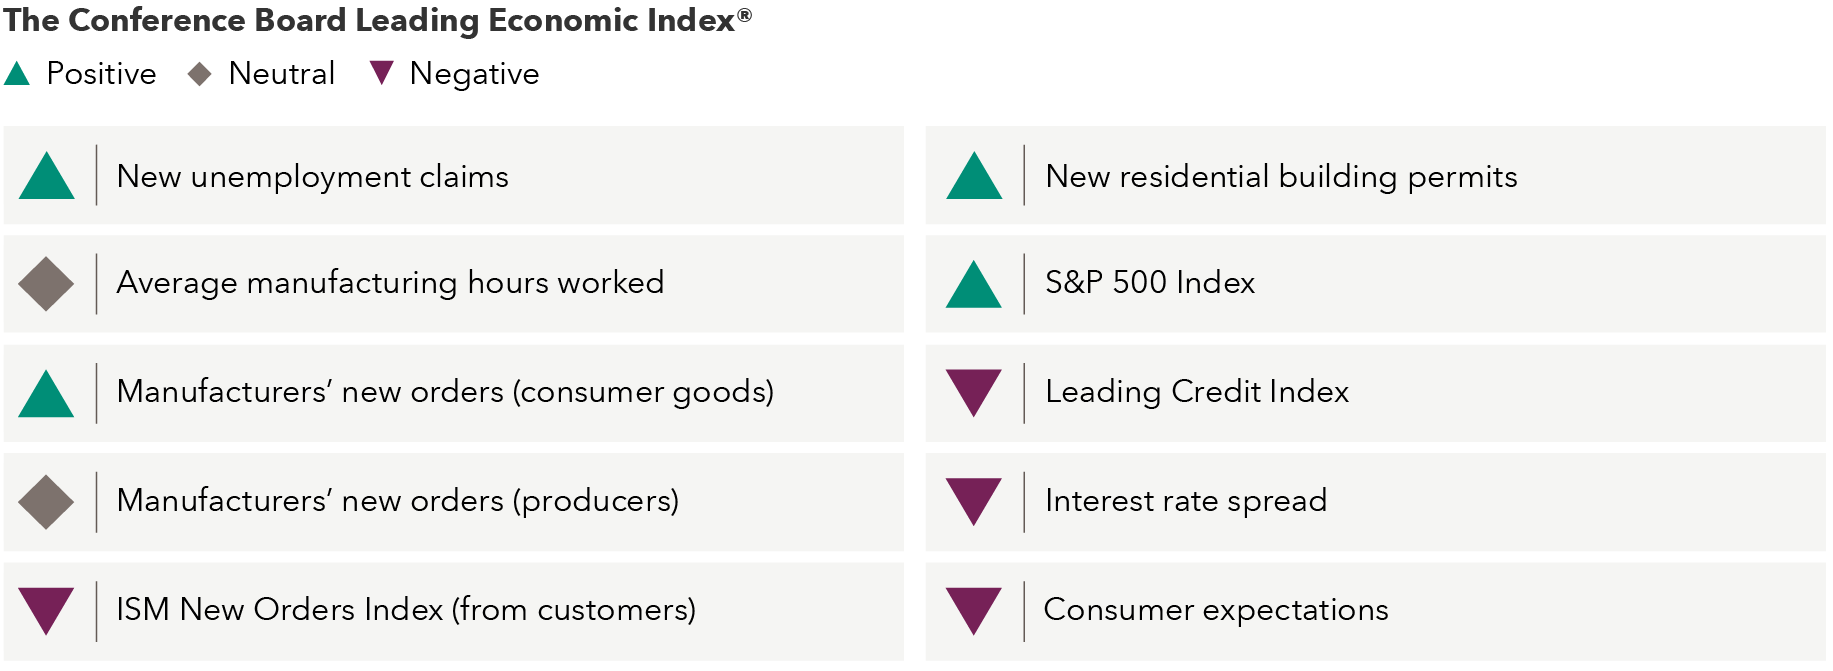
Source: The Conference Board. The table shows the 10 components of The Conference Board Leading Economic Index and indicates if each is expected to have a positive, neutral or negative impact on U.S. economic growth, based on current levels and six-month trends, as of October 31, 2023.
6. Despite high U.S. equity valuations, diverse market opportunities abound
The top-heavy equity market in the U.S. may lead your clients to believe that they have missed out or waited too long. The fact is that there are broad, diversified investment opportunities to be had in both domestic and international markets.
For example, as investors focused on tech growth stocks in 2023, valuations for dividend-paying stocks quietly drifted to multi-decade relative lows. With economic growth expected to moderate in 2024, and the potential for recession lingering, dividends may take a more prominent role in driving total returns.
Well-priced dividend payers
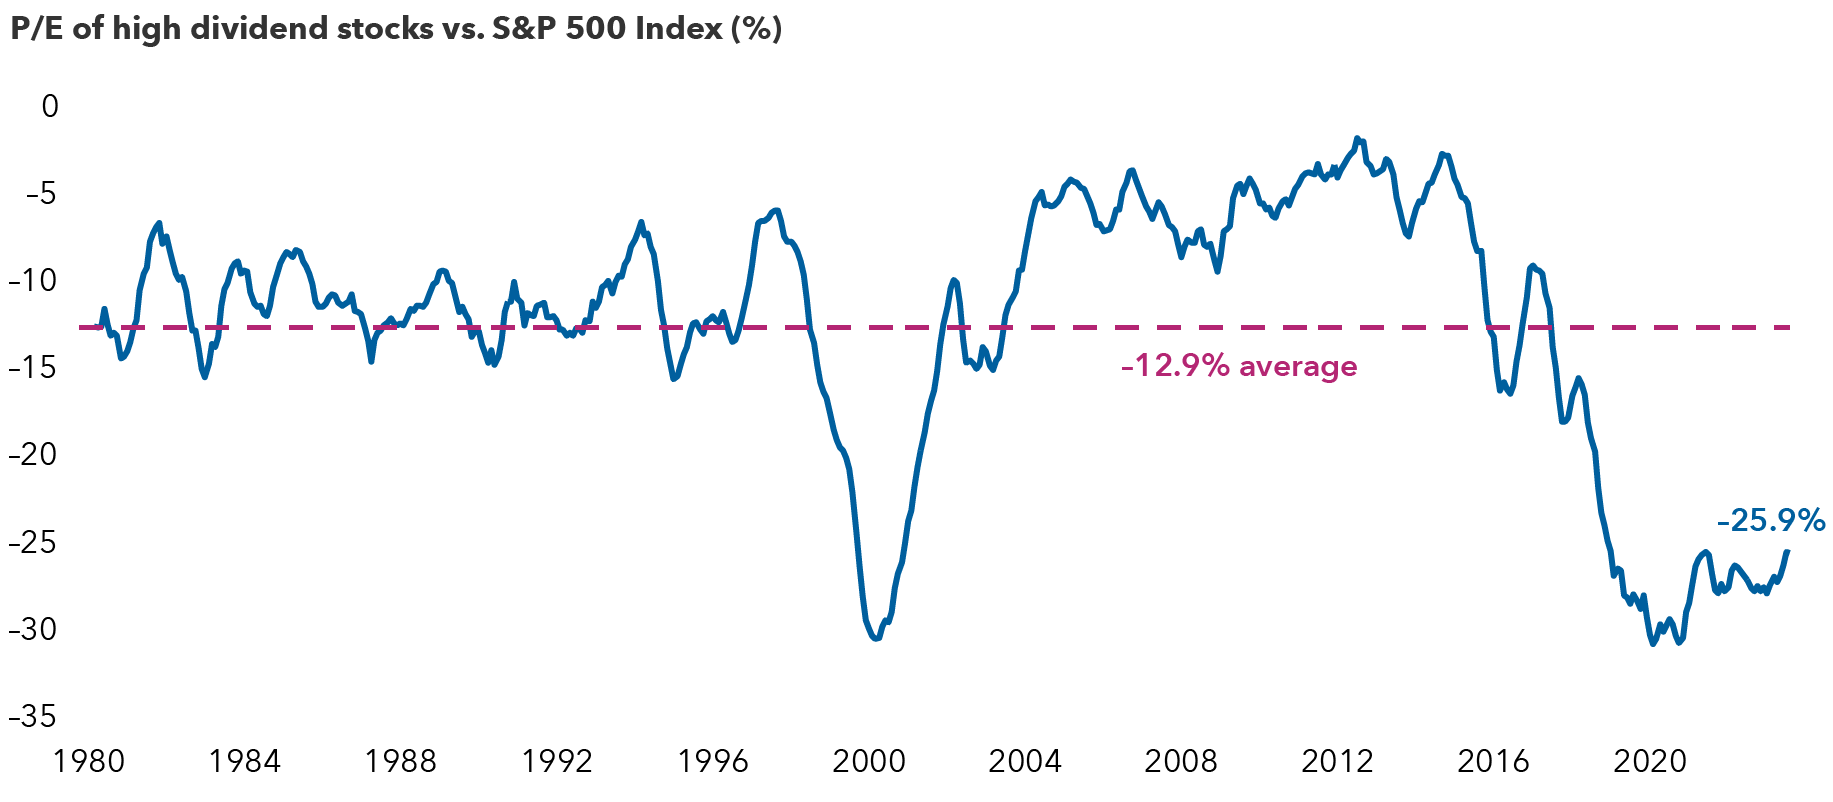
Sources: Capital Group, Goldman Sachs. As of November 28, 2023. High dividend stocks refer to the cohort of stocks in the S&P 500 Index with the highest quintile dividend yield (sector-neutral) within the index. Line represents smoothed six-month average. P/E ratio = price-to-earnings ratio. Past results are not predictive of results in future periods.
Likewise, while the U.S. remains an innovation powerhouse, many European companies are making advancements across a range of industries. These advancements could provide portfolios with diversified opportunities in less top-heavy markets.
The S&P 500 is top-heavy relative to history and international markets
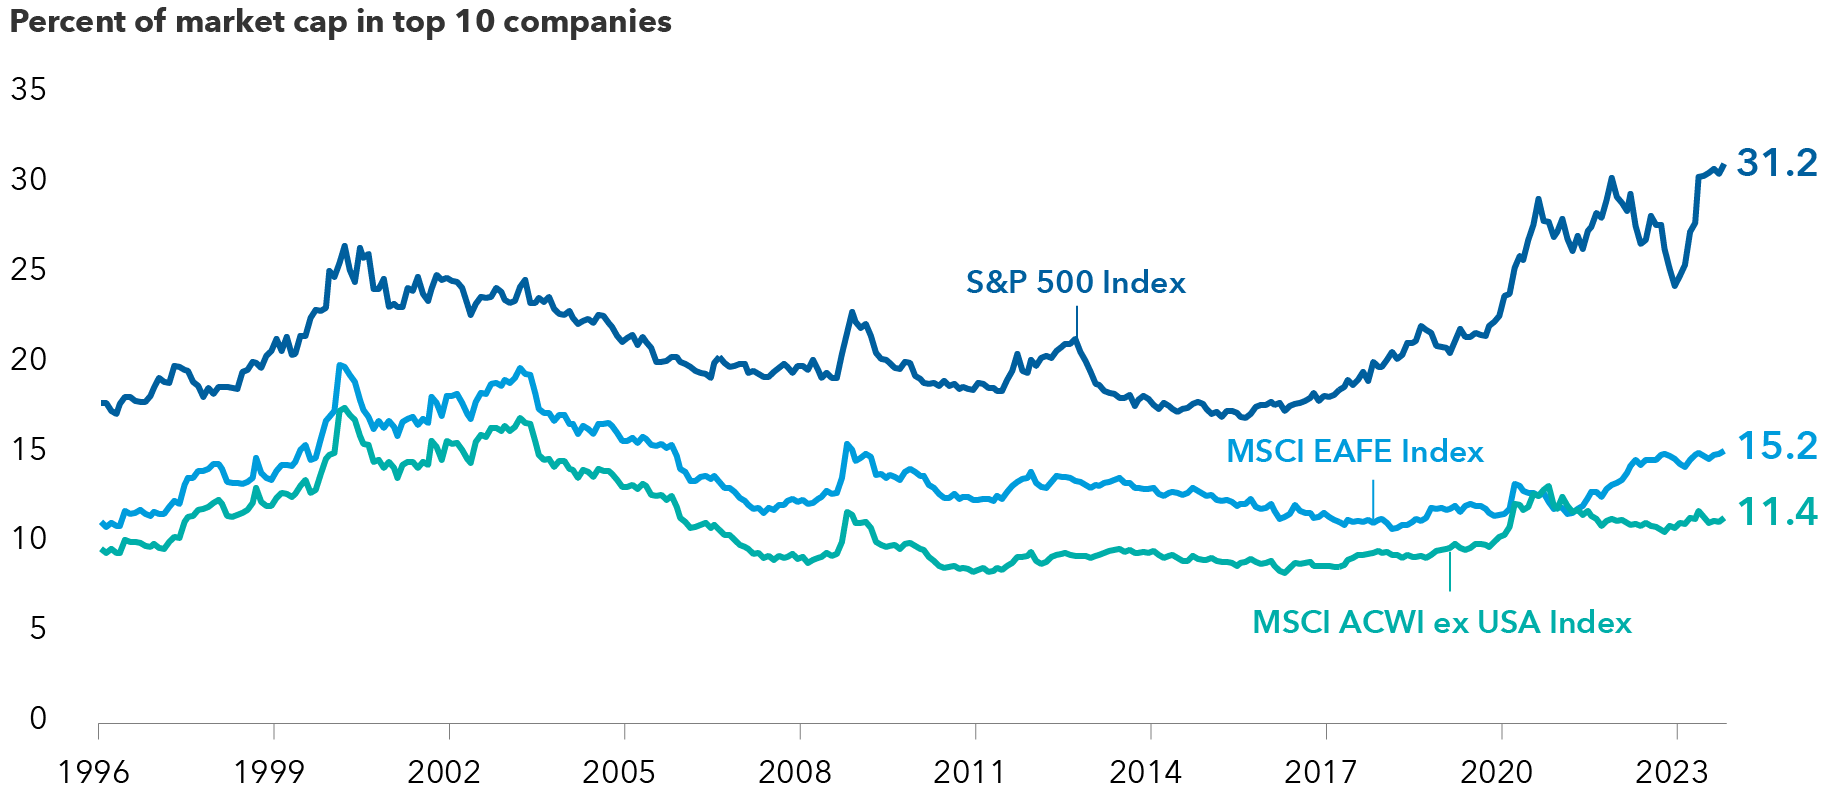
Sources: Capital Group, Morningstar. As of October 31, 2023. Past results are not predictive of results in future periods.
Amidst uncertainty, focus on the many opportunities offered by a new investment landscape
The start of 2024 has been marked with more uncertainty in the investing landscape than many professional investors can remember. However, there are reasons to be optimistic, including an abundance of opportunities for selective investing.
As you review your clients’ investments, Capital Group’s portfolio consultants are available to help identify specific areas of risk and opportunity. Consider scheduling a portfolio consultation with one of our specialists today.
1Based on an average of the four most recent cycles, which began on March 1, 1995, June 1, 2000, July 1, 2006, and January 1, 2019, respectively.
2Capital Group, Bloomberg Index Services Ltd., Standard & Poor’s, U.S. Federal Reserve.
3Source: Standard & Poor’s. S&P CoreLogic Case-Shiller 20-City Composite Home Price Index (month-over-month % change). Latest available monthly data is September 2023, as of November 30, 2023.
Learn more about
Investments are not FDIC-insured, nor are they deposits of or guaranteed by a bank or any other entity, so they may lose value.
For financial professionals only. Not for use with the public.
Investors should carefully consider investment objectives, risks, charges and expenses.
This and other important information is contained in the fund prospectuses and summary prospectuses, which can be obtained from a financial professional and should be read carefully before investing.
Past results are not predictive of results in future periods.
There may have been periods when the results lagged the index(es) and/or average(s).
The indexes are unmanaged and, therefore, have no expenses. Investors cannot invest directly in an index.
Source: Bloomberg Index Services Limited. BLOOMBERG® is a trademark and service mark of Bloomberg Finance L.P. and its affiliates (collectively "Bloomberg"). Bloomberg or Bloomberg's licensors own all proprietary rights in the Bloomberg Indices. Neither Bloomberg nor Bloomberg's licensors approves or endorses this material, or guarantees the accuracy or completeness of any information herein, or makes any warranty, express or implied, as to the results to be obtained therefrom and, to the maximum extent allowed by law, neither shall have any liability or responsibility for injury or damages arising in connection therewith.
MSCI has not approved, reviewed or produced this report, makes no express or implied warranties or representations and is not liable whatsoever for any data in the report. You may not redistribute the MSCI data or use it as a basis for other indices or investment products.
Each S&P Index ("Index") shown is a product of S&P Dow Jones Indices LLC and/or its affiliates and has been licensed for use by Capital Group. Copyright © 2024 S&P Dow Jones Indices LLC, a division of S&P Global, and/or its affiliates. All rights reserved. Redistribution or reproduction in whole or in part is prohibited without written permission of S&P Dow Jones Indices LLC.
Statements attributed to an individual represent the opinions of that individual as of the date published and do not necessarily reflect the opinions of Capital Group or its affiliates. This information is intended to highlight issues and should not be considered advice, an endorsement or a recommendation.
All Capital Group trademarks mentioned are owned by The Capital Group Companies, Inc., an affiliated company or fund. All other company and product names mentioned are the property of their respective companies.
Use of this website is intended for U.S. residents only.
American Funds Distributors, Inc.
This content, developed by Capital Group, home of American Funds, should not be used as a primary basis for investment decisions and is not intended to serve as impartial investment or fiduciary advice.
© 2024 Morningstar, Inc. All Rights Reserved. Some of the information contained herein: (1) is proprietary to Morningstar and/or its content providers; (2) may not be copied or distributed; and (3) is not warranted to be accurate, complete or timely. Neither Morningstar, its content providers nor Capital Group are responsible for any damages or losses arising from any use of this information. Past performance is no guarantee of future results. Information is calculated by Morningstar. Due to differing calculation methods, the figures shown here may differ from those calculated by Capital Group.
Investments are not FDIC-insured, nor are they deposits of or guaranteed by a bank or any other entity, so they may lose value.
Investors should carefully consider investment objectives, risks, charges and expenses.
This and other important information is contained in the fund prospectuses and summary prospectuses, which can be obtained from a financial professional and should be read carefully before investing.
All Capital Group trademarks mentioned are owned by The Capital Group Companies, Inc., an affiliated company or fund. All other company and product names mentioned are the property of their respective companies.
Use of this website is intended for U.S. residents only.
American Funds Distributors, Inc.
This content, developed by Capital Group, home of American Funds, should not be used as a primary basis for investment decisions and is not intended to serve as impartial investment or fiduciary advice.