Interest Rates
Categories
Investing Strategy
Midyear Outlook: Is it really different this time?
At the midpoint of 2023, investment markets are experiencing a period of uncertainty and change. We are seeing the end of a nearly 40-year disinflation/deflation cycle. Inflation is on a downward slope due to lower energy prices, fewer supply chain disruptions and one of the most aggressive tightening campaigns by central banks in history. A recession is likely in the coming months ahead, but the recovery could be robust.
Interest rates are sharply higher than they were a year ago (although still low by historical standards). This increase in the real cost of money has a profound effect — companies must make capital work more efficiently, investors value stocks on earnings as well as growth, and fixed income markets compete more aggressively with equity markets.
KEY TAKEAWAYS
- Investment markets around the world are in a state of rapid transition, which breeds both uncertainty and new opportunities and creates a potentially attractive environment for active investors.
- Equity market leadership has broadened beyond a handful of tech stocks to include sectors like energy, health care and industrials, as well as value-oriented and dividend-paying stocks.
- Higher interest rates have created an array of investment opportunities in various fixed income sectors, from U.S. Treasuries and U.S. corporate bonds to high-yield securities and emerging market sovereign debt.
At the midpoint of 2023, investment markets are experiencing a period of uncertainty and change. We are seeing the end of a nearly 40-year disinflation/deflation cycle. Inflation is on a downward slope due to lower energy prices, fewer supply chain disruptions and one of the most aggressive tightening campaigns by central banks in history. A recession is likely in the coming months ahead, but the recovery could be robust.
Interest rates are sharply higher than they were a year ago (although still low by historical standards). This increase in the real cost of money has a profound effect — companies must make capital work more efficiently, investors value stocks on earnings as well as growth, and fixed income markets compete more aggressively with equity markets.
The end of a 40-year cycle?
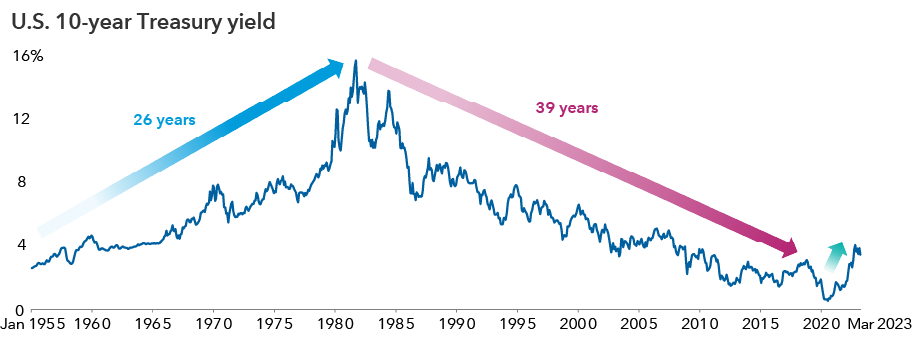
Sources: Capital Group, Refinitiv Datastream. As of March 31, 2023. Past results are not predictive of results in future periods.
Transition and turmoil have widened the opportunity set for investors. Leadership in the equity markets has broadened beyond a handful of tech stocks. U.S. equities are more fairly valued. U.S. fixed income returns are set to benefit from higher starting yields and a possible decline in interest rates. International equities and bonds should be supported by a weaker U.S. dollar.
“Entering 2023, our long-term capital markets return assumptions show a more appealing investment environment,” says solutions portfolio manager Michelle Black. “I see better corporate fundamentals and a currency tailwind more than offsetting potentially slower global economic growth.”
Many asset classes offer better long-term potential than cash
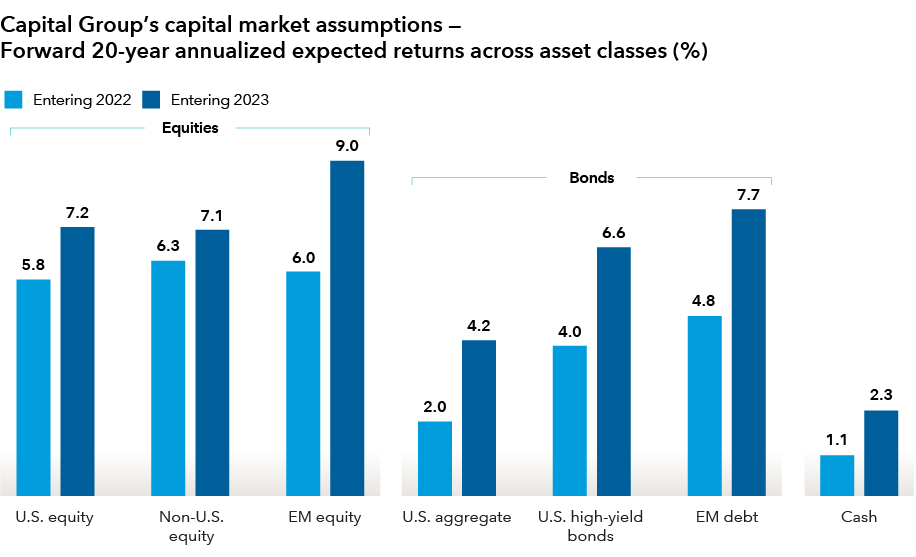
Source: Capital Group, as of December 31, 2022. All asset classes reflect asset class historical proxies used in Capital Market Assumptions (CMAs) as of December 31, 2022. All assumptions are for market asset classes only and are reviewed at least annually. These figures represent the views of a small group of investment professionals based on their individual research and are approved by the Capital Market Assumptions Oversight Committee. They should not be interpreted as the view of Capital Group as a whole. As Capital Group employs The Capital System™, the views of other individual analysts and portfolio managers may differ from those presented here. They are provided for informational purposes only and are not intended to provide any assurance or promise of actual returns. They reflect long-term projections of asset class returns and are based on the respective historical proxies, or other proxies, and therefore do not include any outperformance gain or loss that may result from active portfolio management. Note that the actual results will be affected by any adjustments to the mix of asset classes. All market forecasts are subject to a wide margin of error. EM = emerging markets. EM debt is a blend of 50% emerging markets debt denominated in U.S. dollars and 50% emerging markets debt denominated in domestic currency. Capital Market Assumptions (CMAs) historical proxies: U.S. equity = MSCI USA; non-U.S. equity = MSCI World ex USA; EM equity = MSCI Emerging Markets; U.S. aggregate = Bloomberg U.S. Aggregate Index; U.S. high-yield bonds = Bloomberg U.S. Corporate High Yield 2% Issuer Capped Index; EM debt = 50% J.P. Morgan Emerging Markets Bond Index (EMBI) Global Diversified / 50% J.P. Morgan Government Bond Index — Emerging Markets Global Diversified; cash = FTSE 3-Month U.S. T-Bill Index Series.
The new investing world is attractive to active investors because of the many opportunities emerging around the world. Given the uncertainties of the past year or two, a lot of cash and cash alternatives have built up on the sidelines. Now may be the time to consider putting it to work.
To help advisors prepare for client conversations about risk, opportunity and portfolio construction in the second half of 2023, we have identified key outlook themes for the rest of the year.
The equity opportunity set is widening
Despite the recent rally in blue-chip tech stocks, tech is no longer the only game in town. Equity market opportunities have broadened to include sectors like energy, health care and industrials, plus value-oriented and dividend-paying stocks. Returns have been less U.S.-centric and more evenly distributed around the world. Following sharp declines, valuations in U.S. equities have been more reasonable. Non-U.S. equities should be propelled by higher dividend yields, multiple expansion and a weaker dollar.
Around the world, equity market breadth has increased sharply since the end of 2021 in contrast to the prior six years. “There are many long-term secular themes in sectors beyond technology,” says Jody Jonsson, a portfolio manager with New Perspective Fund®. “For instance, we are witnessing an incredible age of discovery in health care. It’s perhaps the most fertile environment I’ve seen in my career.”
Market leadership moves beyond the narrow few
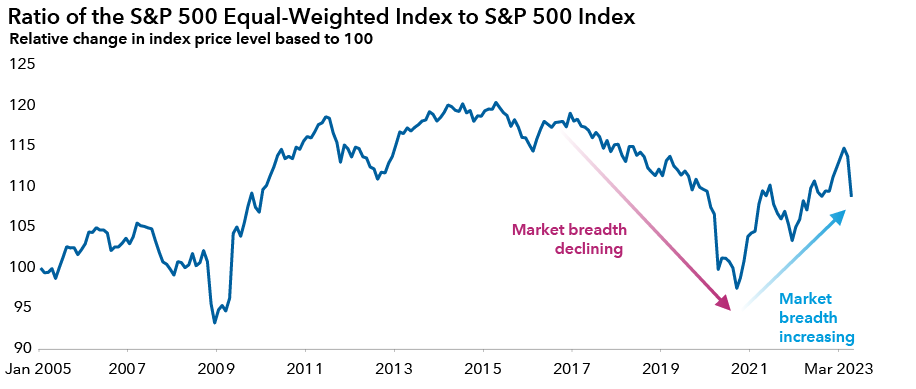
Sources: Capital Group, Refinitiv Datastream, S&P Dow Jones Indices LLC. As of March 31, 2023. Indexed to 100 as of January 1, 2005. The S&P 500 Index is a market capitalization weighted index, while the S&P 500 Equal-Weighted Index weights all the constituents within the S&P 500 equally. When the change in price level between the equal-weighted index and market cap index is greater for the equal weighted index, market breadth is seen to be increasing as a greater number of companies are attributable to observed changes in index price level. When the change in price level is greater for the market cap index, market breadth is seen to be declining as a smaller subset of constituents are attributable to observed changes in index price level. Past results are not predictive of results in future periods.
Dividends will play a bigger role in total returns
When growth slows and market volatility rises, dividends take on greater importance. Dividends allow returns to be better balanced between capital appreciation and income, reducing market volatility and supporting growth and income-oriented strategies. Dividends contributed an average 38% of the S&P 500 Index’s total return over the past almost 100 years, but their share fell sharply during the growth-obsessed markets of the past two decades. But the story has now changed: Dividend contributions to total returns are rising, as are total payments to investors.
Dividends reclaim their historical role
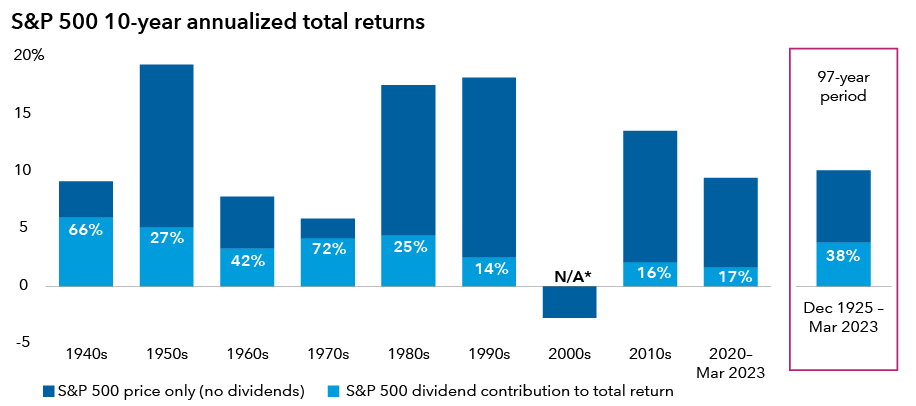
Source: Capital Group. As of March 31, 2023. Past results are not predictive of results in future periods.
*Total return for the S&P 500 Index was negative for the 2000s. Dividends provided a 1.8% annualized return over the decade.
Globally, company payouts increased by 12.3% for the 12 months ended May 31, 2023, and continued growth in dividends is anticipated. Dividend yields in key sectors like energy, real estate, utilities, materials and financials are currently in the 3.5%‒5.0% range. “I expect dividends will be of greater significance to investors this year and beyond,” equity portfolio manager Caroline Randall says. “But in a period of relative instability and rising debt costs, it is essential to focus on the quality of dividend payers.” For Randall, that means closely scrutinizing company balance sheets, credit ratings and interest costs. This has guided her to invest in companies across pharmaceutical and medical device firms, utilities, energy producers and some industrials.
Income is back in fixed income
In the new world of higher interest rates, the credit markets are offering a broader set of opportunities. The Bloomberg U.S. Aggregate Index was yielding 4.59% at the end of May 2023, illustrating the meaningful return potential available to investors.
“We favor positioning portfolios that would benefit from a steepening of the Treasury yield curve,” notes Capital Group portfolio manager Ritchie Tuazon. If the economy continues to weaken, short-term Treasury yields may drift lower, particularly if Fed rate cuts are more likely, which would cause the curve to steepen.
Historically, corporate bonds have weakened in a recession, but this time could be different. According to Capital Group portfolio manager Scott Sykes, corporations with investment-grade ratings (BBB/Baa and above) generally have strong balance sheets, and most corporate bonds are trading at a discount, which provides a valuation cushion. In the meantime, yields are compelling, around 5% in the investment grade sector, a 130-basis point spread over Treasuries.
Higher starting yields have led to better returns for investment-grade bonds
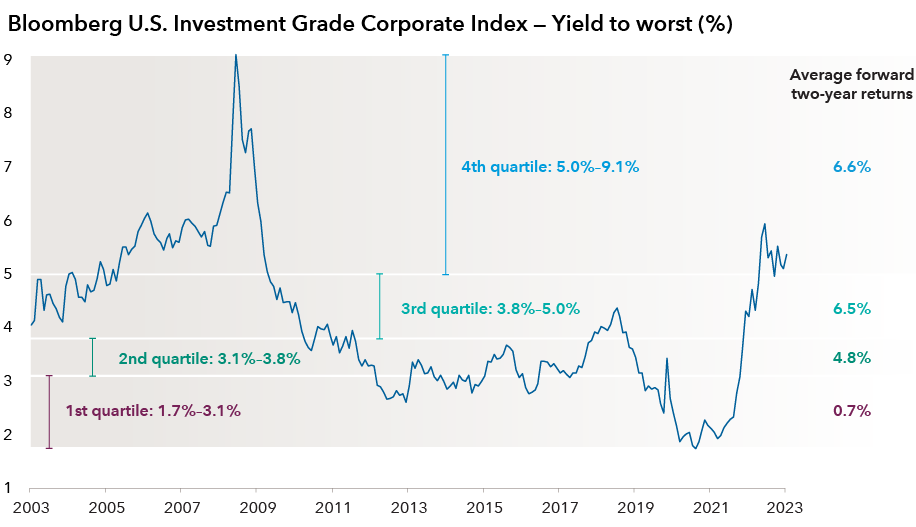
Sources: Capital Group, Bloomberg Index Services Ltd. As of May 31, 2023. Average forward two-year returns are annualized, based on each quartile of starting yield to worst. Yield to worst is a measure of the lowest possible yield that can be received on a bond that fully operates within the terms of its contract without defaulting. Past results are not predictive of results in future periods.
In the high-yield market, current yields are between 7.6% and 9.2%. Despite a possible recession, investing at this rate level has historically offered solid returns to those with longer time horizons.
Municipal bonds (“munis”) are having their moment, with higher yields and healthy state balance sheets. Munis have historically weathered economic downturns relatively well. As an example, in the top tax bracket, the Bloomberg Municipal Bond Index currently has a roughly 6.1% taxable equivalent yield (assuming the 3.8% Medicare tax and top federal marginal tax rate for 2023 of 37%).
And don’t ignore emerging market bonds. Many developing economies were ahead of the developed world in tackling inflation and are now benefiting from attractive rates and moderating inflation. A weaker U.S. dollar could be an added tailwind. However, selectivity is key, says Capital Group portfolio manager Kirstie Spence, given the divergence in policy and inflation dynamics across countries. On balance, she favors a modest tilt toward local currency issuers compared to hard currency credits. She sees potential value in Latin American local currency bonds given the combination of attractive nominal and positive real rates, moderate inflation, proactive behavior on the part of central banks and a reasonable growth outlook.
A recession is likely: Use it to position for the next cycle
An economic slowdown is expected. If it occurs, it will be one of the most widely anticipated recessions in history. This means it may already be priced into financial markets, and the U.S. economy seems well-prepared. Companies have cleaned up inventories and balance sheets. Personal debt in the U.S. is low relative to past recessions. And moderating inflation acts like a wage increase for many consumers. For these reasons, says Capital Group economist Jared Franz, “investors may be better served by preparing for what I expect will be a stronger-than-usual recovery.”
Uncertain investors have built a mountain of cash and cash alternatives on the sidelines. Money market deposits reached a record $5.4 trillion as of May 31, 2023. These peaks have often occurred near market troughs. Now could be a good time to put money to work. Franz notes that strong consumer spending post-recession could drive a range of industries, including travel, leisure and housing, the last of which is a multiplier for spending on construction and durable goods.
Well-prepared for what’s ahead
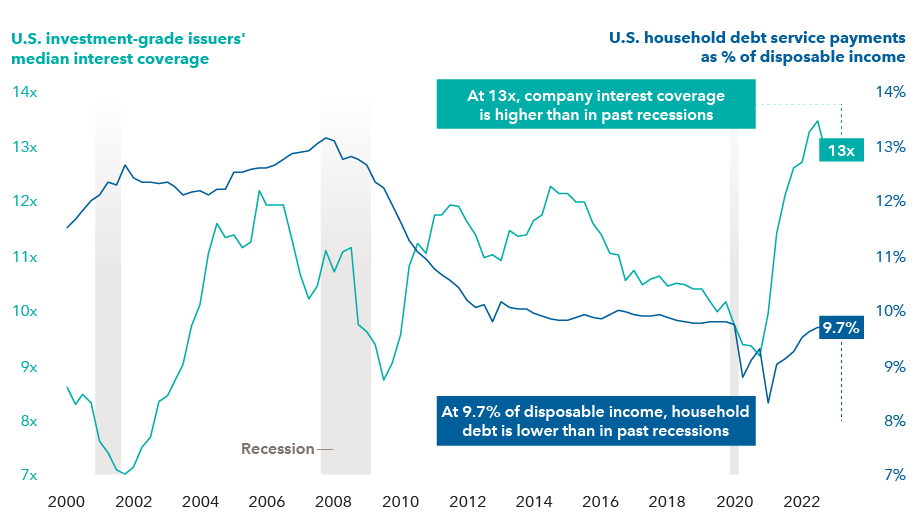
Sources: Capital Group, Federal Reserve Bank of St. Louis, Morgan Stanley, National Bureau of Economic Research. Interest coverage reflects the ratio between earnings before interest and taxes (EBIT) and interest expense. Shaded bars represent U.S. recessions as defined by the National Bureau of Economic Research. Data as of December 31, 2022.
Fortune favors the active investor
The brave new world of investing abounds in opportunities for those willing to do their homework, look globally and keep an eye on risk. It can be an opportunistic environment for the active investor, with an array of selective possibilities in equity and fixed income markets around the world.
As you review today’s opportunities relative to your clients’ current portfolio positioning, Capital Group’s investment consultants can help you identify specific areas to focus on. Consider scheduling a portfolio consultation with one of our specialists today.
Learn more about
To read the full article, become an RIA Insider. You'll also gain complimentary access to news, insights, tools and more.
Already an Insider?
Investments are not FDIC-insured, nor are they deposits of or guaranteed by a bank or any other entity, so they may lose value.
Investors should carefully consider investment objectives, risks, charges and expenses.
This and other important information is contained in the fund prospectuses and summary prospectuses, which can be obtained from a financial professional and should be read carefully before investing.
Statements attributed to an individual represent the opinions of that individual as of the date published and do not necessarily reflect the opinions of Capital Group or its affiliates. This information is intended to highlight issues and should not be considered advice, an endorsement or a recommendation.
All Capital Group trademarks mentioned are owned by The Capital Group Companies, Inc., an affiliated company or fund. All other company and product names mentioned are the property of their respective companies.
Use of this website is intended for U.S. residents only.
American Funds Distributors, Inc.
This content, developed by Capital Group, home of American Funds, should not be used as a primary basis for investment decisions and is not intended to serve as impartial investment or fiduciary advice.
Investments are not FDIC-insured, nor are they deposits of or guaranteed by a bank or any other entity, so they may lose value.
Investors should carefully consider investment objectives, risks, charges and expenses.
This and other important information is contained in the fund prospectuses and summary prospectuses, which can be obtained from a financial professional and should be read carefully before investing.
Investing outside the United States involves risks, such as currency fluctuations, periods of illiquidity and price volatility. These risks may be heightened in connection with investments in developing countries.
Unlike mutual fund shares, investments in U.S Treasuries are guaranteed by the U.S. government as to the payment of principal and interest. In addition, certificates of deposit (CDs) are FDIC-insured and, if held to maturity, offer a guaranteed return of principal.
There may have been periods when the results lagged the index(es) and/or average(s).
The indexes are unmanaged and, therefore, have no expenses. Investors cannot invest directly in an index.
Source: Bloomberg Index Services Limited. BLOOMBERG® is a trademark and service mark of Bloomberg Finance L.P. and its affiliates (collectively "Bloomberg"). Bloomberg or Bloomberg's licensors own all proprietary rights in the Bloomberg Indices. Neither Bloomberg nor Bloomberg's licensors approves or endorses this material, or guarantees the accuracy or completeness of any information herein, or makes any warranty, express or implied, as to the results to be obtained therefrom and, to the maximum extent allowed by law, neither shall have any liability or responsibility for injury or damages arising in connection therewith.
MSCI has not approved, reviewed or produced this report, makes no express or implied warranties or representations and is not liable whatsoever for any data in the report. You may not redistribute the MSCI data or use it as a basis for other indices or investment products.
FTSE/Russell indexes: London Stock Exchange Group plc and its group undertakings (collectively, the “LSE Group”). © LSE Group 2024. FTSE Russell is a trading name of certain of the LSE Group companies. FTSE indexes are trademarks of the relevant LSE Group companies and are used by any other LSE Group company under license. All rights in the FTSE Russell indexes or data vest in the relevant LSE Group company which owns the index or the data. Neither LSE Group nor its licensors accept any liability for any errors or omissions in the indexes or data and no party may rely on any indexes or data contained in this communication. No further distribution of data from the LSE Group is permitted without the relevant LSE Group company's express written consent. The LSE Group does not promote, sponsor or endorse the content of this communication.
This report, and any product, index or fund referred to herein, is not sponsored, endorsed or promoted in any way by J.P. Morgan or any of its affiliates who provide no warranties whatsoever, express or implied, and shall have no liability to any prospective investor, in connection with this report. J.P. Morgan disclaimer: https://www.jpmm.com/research/disclosures
Each S&P Index ("Index") shown is a product of S&P Dow Jones Indices LLC and/or its affiliates and has been licensed for use by Capital Group. Copyright © 2024 S&P Dow Jones Indices LLC, a division of S&P Global, and/or its affiliates. All rights reserved. Redistribution or reproduction in whole or in part is prohibited without written permission of S&P Dow Jones Indices LLC.
Statements attributed to an individual represent the opinions of that individual as of the date published and do not necessarily reflect the opinions of Capital Group or its affiliates. This information is intended to highlight issues and should not be considered advice, an endorsement or a recommendation.
Capital Group manages equity assets through three investment groups. These groups make investment and proxy voting decisions independently. Fixed income investment professionals provide fixed income research and investment management across the Capital organization; however, for securities with equity characteristics, they act solely on behalf of one of the three equity investment groups.
All Capital Group trademarks mentioned are owned by The Capital Group Companies, Inc., an affiliated company or fund. All other company and product names mentioned are the property of their respective companies.
Use of this website is intended for U.S. residents only.
American Funds Distributors, Inc.
This content, developed by Capital Group, home of American Funds, should not be used as a primary basis for investment decisions and is not intended to serve as impartial investment or fiduciary advice.
For financial professionals only. Not for use with the public.