Portfolio Construction
Categories
ETF
Where active ETFs are gaining traction today
The first actively managed ETFs invested in bonds, and that’s still where nearly half of the assets sit. But active ETFs for equities and other asset classes are catching up. There are many factors driving this trend, including advisors gaining greater comfort with the active ETF structure, plateauing interest in smart beta strategies (rules-based strategies that combine active and passive investing) and more well-known asset managers introducing active ETFs for core portfolios.
We provide a brief history of actively managed ETFs and describe areas of the market that are gaining more traction with advisors and investors. We also explain what advisors need to know about active ETF transparency and mutual fund conversions when researching this fast-growing market on behalf of their clients.
KEY TAKEAWAYS
- The first active ETFs invested in bonds, which is still the largest category, but other asset classes are catching up as advisors and investors discover the benefits of active ETFs.
- Greater adoption of active ETFs is being driven by an increasing selection of fully transparent active equity ETFs, particularly those designed as core portfolio holdings.
- Active ETF assets are becoming less concentrated in a handful of funds and providers as the category matures.
Actively managed exchange-traded funds (ETFs) have been around since 2008, with roughly half of active ETF assets currently in fixed income strategies.1 But active ETFs that invest in equities and other asset classes are quickly gaining ground due to a greater desire for investor choice and lower interest in smart beta ETFs, among other trends. Growth of active equity ETFs is poised to accelerate as advisors continue to get more comfortable with using fully transparent ETFs as core portfolio building blocks.
This article examines the history of actively managed ETFs, which areas of the active ETF market are leading the current growth trends, and why we are still in the early innings for active ETFs.
History of actively managed ETFs
The first U.S. ETF was listed in 1993, but it took 15 years for the first actively managed ETFs to come to market.2 The first active ETF provided exposure to bonds, and active fixed income ETFs found the greatest early success in terms of attracting investments.
“One of the reasons that active ETFs first gained traction in fixed income is that bond managers were less concerned than equity managers about disclosing their portfolio holdings and opening themselves up to potential front-running or the risk that investors would copy their trades,” says Zahid Nakhooda, Capital Group ETF specialist.
Key events in the evolution of actively managed ETFs
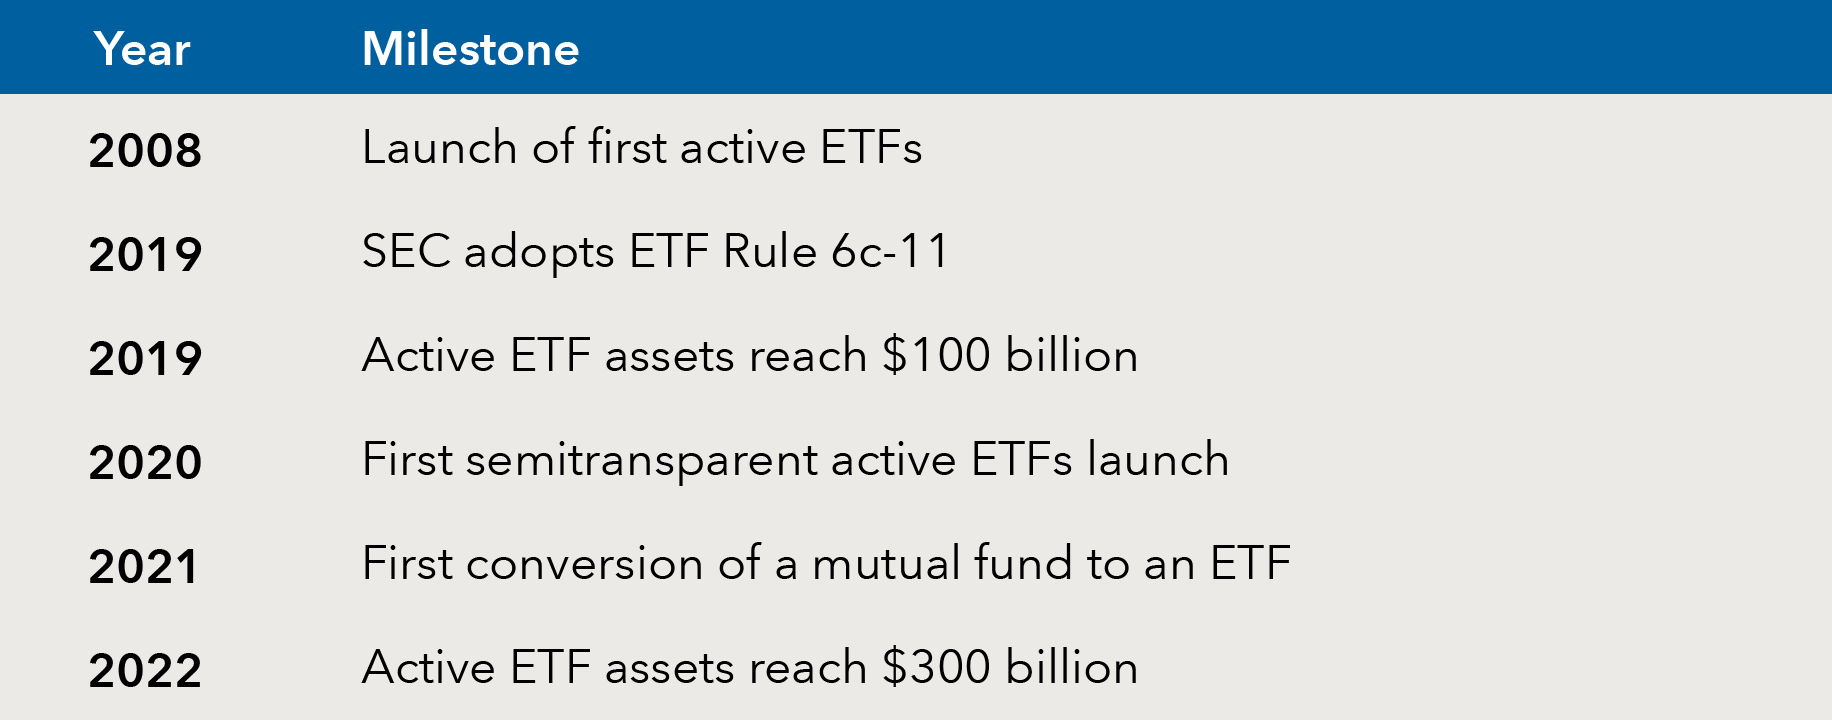
Sources: Morningstar, “The Benefits and Drawbacks of Active ETFs,” June 2, 2021; and Morningstar Direct as of March 31, 2022.
Active ETFs have come a long way since 2008. As a group, U.S. active ETFs ended 2021 with total assets of $292.5 billion — impressive growth considering active ETFs had only about $3.6 billion in total assets in 2010.3 A game-changer for active ETFs was ETF Rule 6c-11 adopted in 2019 by the U.S. Securities and Exchange Commission (SEC), which made it easier for investment managers to launch and manage ETFs.4 Indeed, of the 450 new ETFs launched in 2021, nearly two-thirds were actively managed funds.5 The introduction of semitransparent and nontransparent ETFs recently also brought more active ETFs into the fold.
U.S. active ETFs grew to nearly $300 billion in 2021
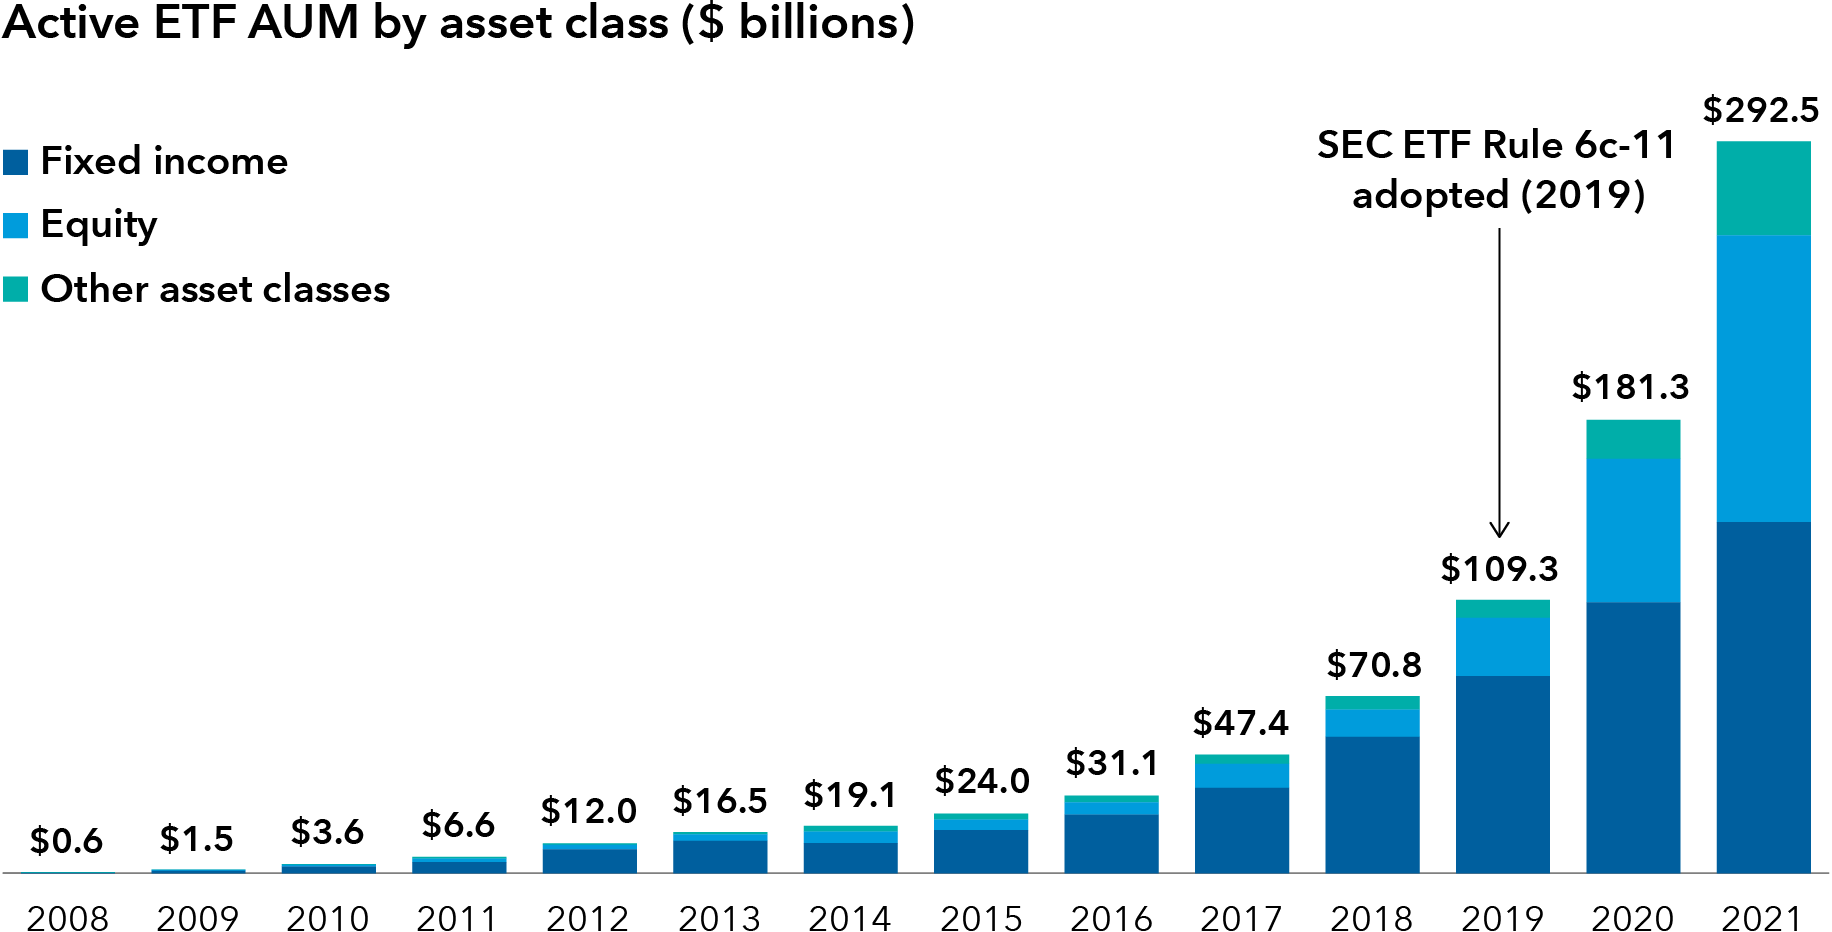
Source: Morningstar Direct as of December 31, 2021.
Where the assets live in active ETFs
When looking at the top categories of active ETFs, fixed income is still the largest asset class with nearly half the total assets, but the overall space continues to evolve and mature. Due to the rapid product development in the active ETF segment, assets are becoming less concentrated in a handful of funds and providers.
Some of the most popular early active ETFs were thematic portfolios targeting specific trends or themes in the market such as artificial intelligence, cybersecurity and renewable energy. The tax efficiency of ETFs made them attractive for active strategies that typically have higher turnover relative to passive strategies. A more recent trend, though, is the introduction of active core equity ETFs, which take a long-term approach that could result in lower turnover relative to thematic portfolios.
For example, more seasoned active asset managers are bringing active ETFs to market and attracting interest from financial advisors who already use their mutual funds. In particular, large active managers are entering the fray with ETFs that offer the strategies and transparency that advisors are using in core portfolios for both equity and fixed income.
There are also ETFs that provide exposure to more niche asset classes like commodities, alternatives, digital assets, and environmental, social and governance (ESG) strategies. “Of course, active ETFs with increasingly complex strategies tend to require more due diligence by advisors and investors,” said Anthony Wingate, an ETF specialist at Capital Group.
Fixed income still rules the active ETF roost
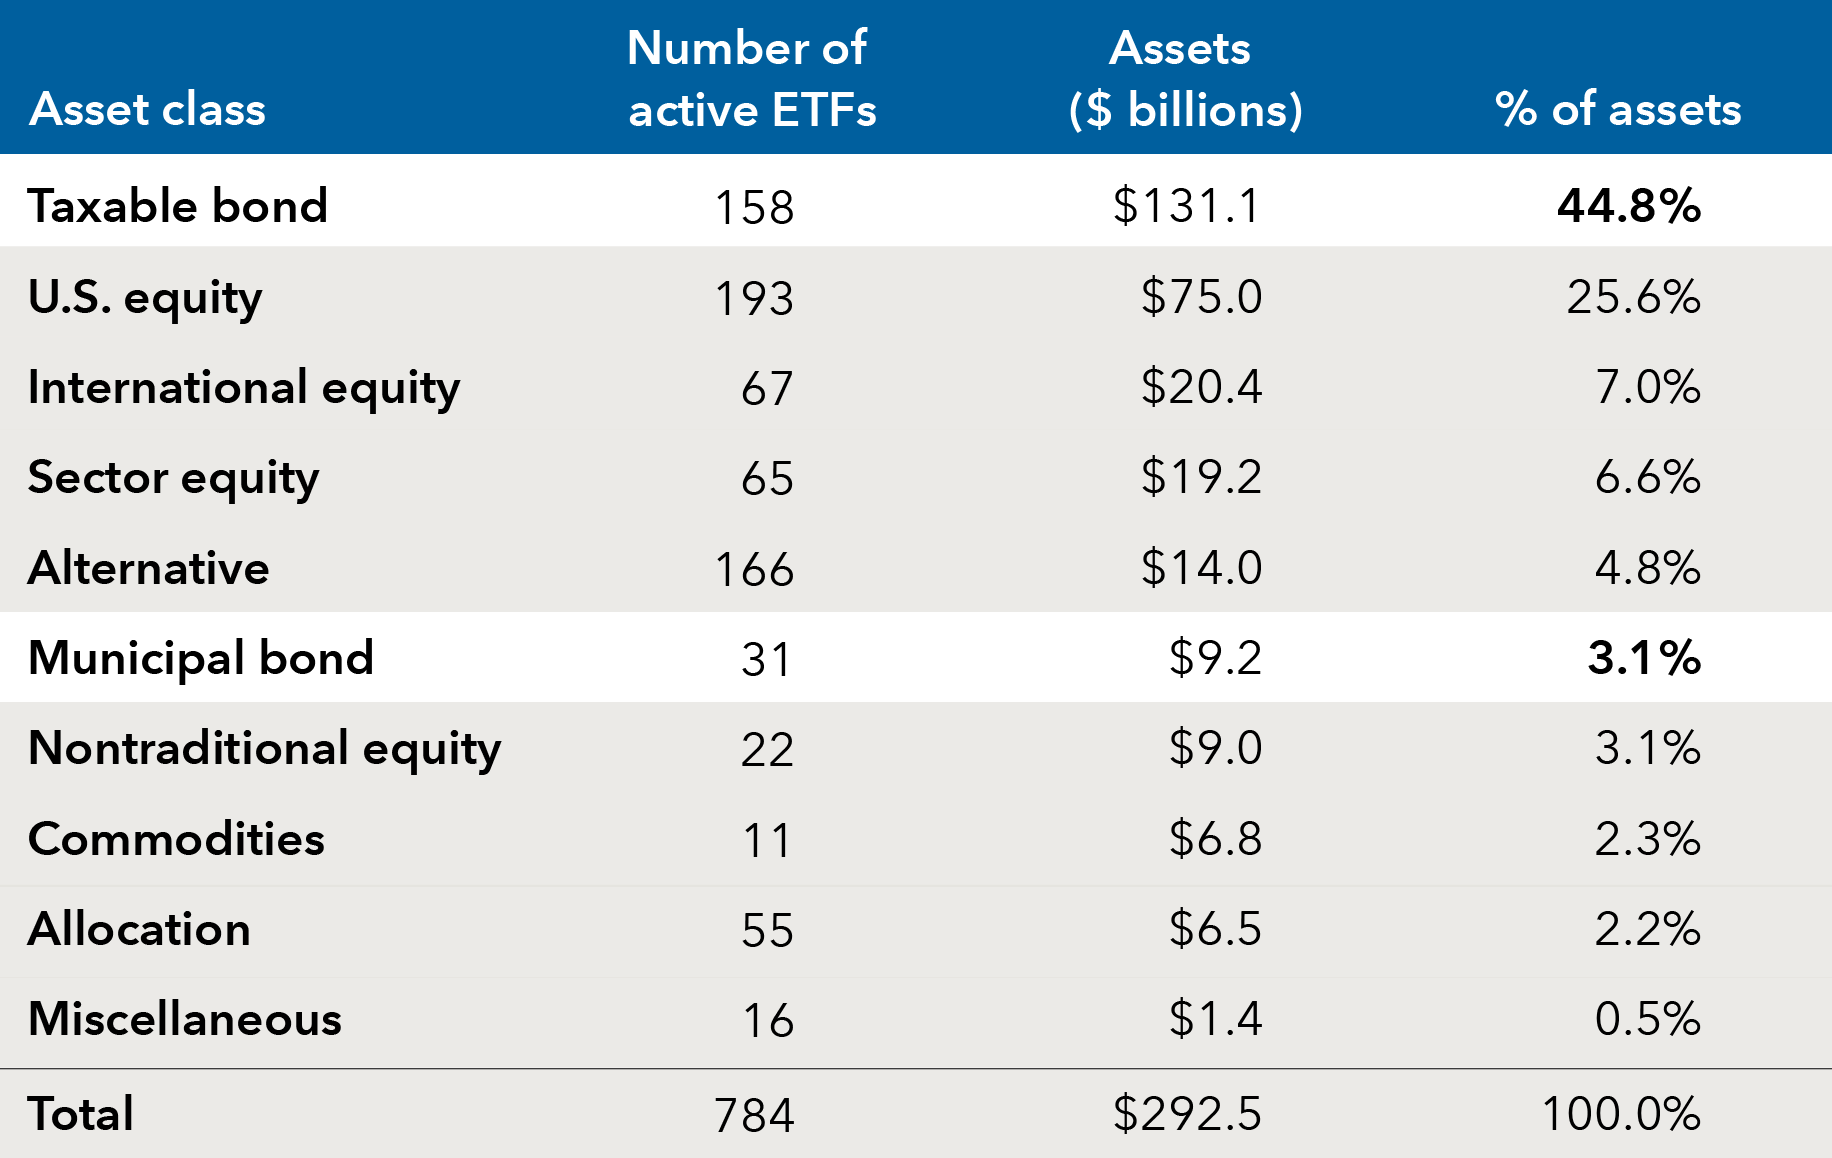
Source: Morningstar Direct as of December 31, 2021. Totals may not reconcile due to rounding.
Active versus smart beta ETFs: More than meets the eye
Although passive strategies still dominate the ETF market, active ETFs appear to be gaining share against smart beta ETFs. Smart beta ETFs are rules-based strategies that often tilt to equity factors such as value and small-cap stocks. Smart beta ETFs are seen as a mix of active and passive investing, and they typically aim to outperform market indexes or reduce volatility.
“Although true active ETFs are a much smaller category than smart beta in terms of overall assets, there are signs that relative growth rates are picking up for active ETFs,” noted John Finneran, Capital Group ETF specialist.
In equities, smart beta ETFs lost market share relative to active ETFs in 2021.6 Active ETFs still represent only about 4% of all ETF assets but accounted for 12% of all ETF flows in the first quarter of 2022, including ETF conversions from existing mutual funds.7
A similar trend is occurring in terms of product launches: The smart beta ETF market is relatively saturated, while active ETFs still appear to be in their early innings.
“It may seem like active and smart beta ETFs compete against each other, but that’s only partly true,” Wingate added. “Many financial advisors use smart beta ETFs as garnish to complement core portfolios, so they may compete against niche or satellite active ETFs. That means active ETFs may have a long runway for growth because they don’t compete directly very much with smart beta ETFs.”
Actively managed ETF inflows are getting a bigger slice of the pie
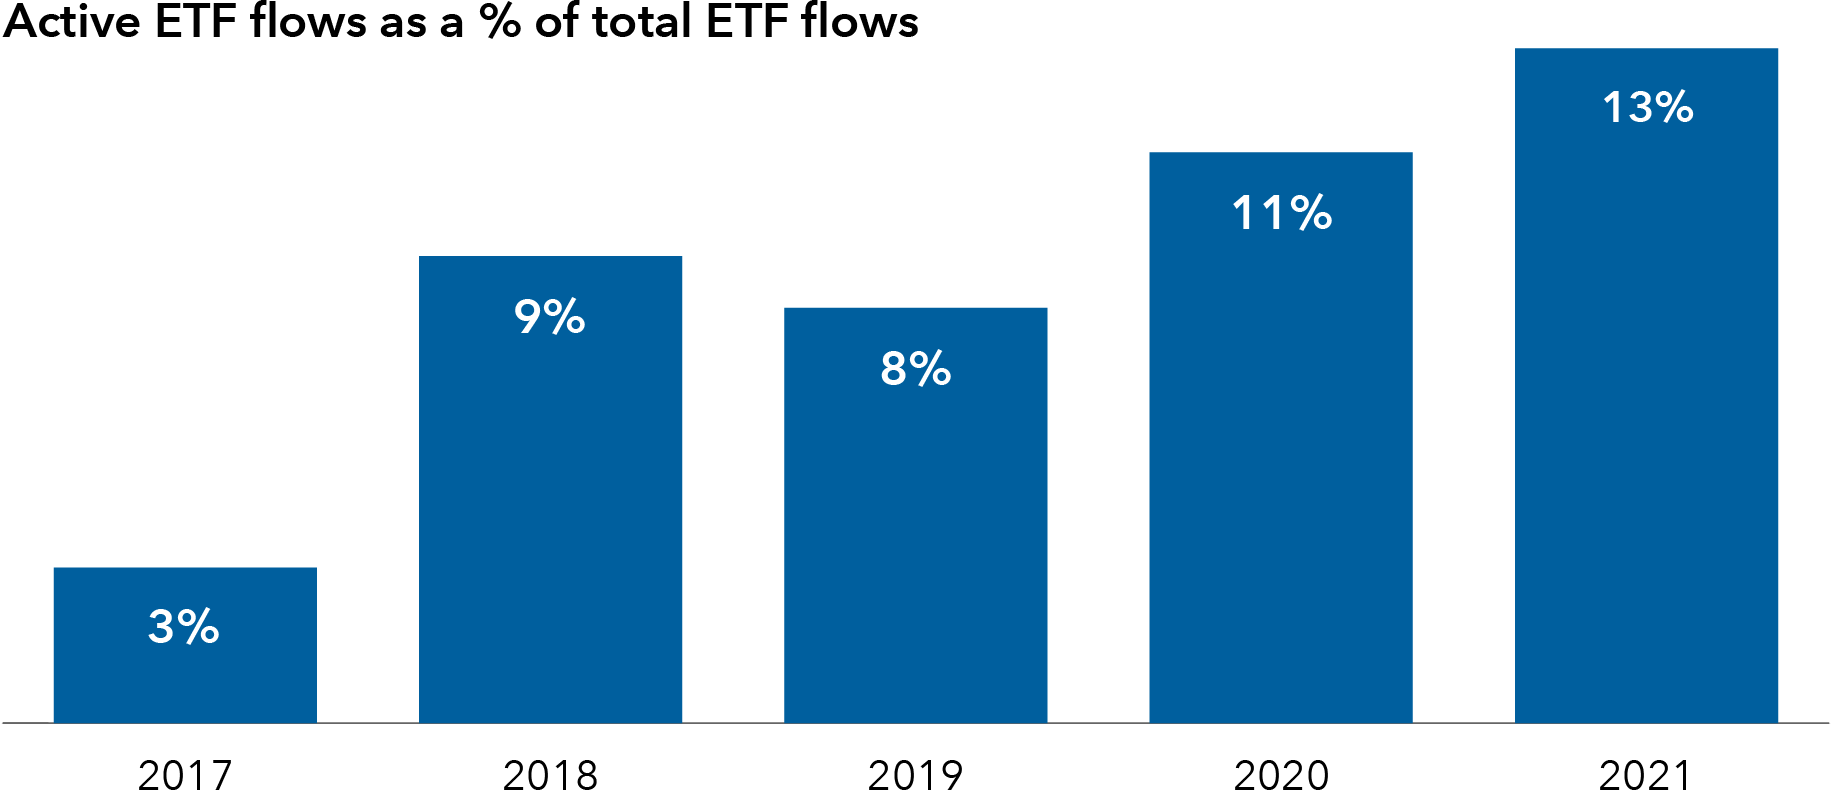
Source: FactSet, “ETF Trends: Familiar Direction, but Bigger,” January 25, 2022.
What advisors should know about active ETF transparency and fund conversions
It is no surprise that more high-profile investment managers are giving advisors the choice to invest in their active strategies through ETFs in addition to mutual funds. ETFs offer investors flexibility because they have no investment minimums and can be bought and sold throughout the day. Advisors also like ETFs’ broadly accepted advantages such as tax efficiency, lower cost and portfolio transparency. Today, many ETFs can be traded without paying brokerage commissions.
When analyzing the active ETF landscape and which areas are gaining traction, it is important for advisors to keep a few distinctions in mind.
First, some asset managers have elected to simply convert their existing active mutual funds into ETFs — otherwise known as mutual fund to ETF conversions. Other managers have kept the existing mutual fund and introduced a “clone” ETF with the same strategy. Meanwhile, other asset managers have decided to start from scratch by launching original actively managed ETFs.
Active ETFs can also be broken down by their levels of portfolio transparency — they can be fully transparent, semi-transparent or nontransparent. Managers of ETFs that aren’t fully transparent don’t have to disclose their holdings as frequently, but there are some restrictions on the types of securities they can invest in. For example, semi-transparent and nontransparent active ETFs may not be able to directly invest in bonds and non-U.S. stocks. These structures must use American Depositary Receipts (ADRs) to gain exposure to non-U.S. stocks, which can limit opportunities and heighten liquidity risk.
Fully transparent active ETFs may also appeal more to investors and advisors who like portfolio transparency as a key benefit of the overall ETF structure.
The next generation of active ETFs
Although fixed income was a conducive starting point for active ETFs, the category is maturing. Active ETFs that invest in equities are gaining traction and moving beyond concentrated strategies and thematic approaches.
Capital Group recently introduced its first fully transparent active ETFs designed to offer more choices for investors along with the full support of Capital Group’s extensive resources backed by more than 90 years of investment experience. We believe fully transparent, active ETFs for core portfolios will be the next important evolution for financial advisors using ETFs.
1Morningstar Direct as of December 31, 2021.
2Morningstar, “The Benefits and Drawbacks of Active ETFs,” June 2, 2021.
3Morningstar Direct as of December 31, 2021.
4Securities and Exchange Commission, “SEC Adopts New Rule to Modernize Regulation of Exchange-Traded Funds,” September 26, 2019.
5ETF Database, “Active Management a Big Trend of 2021,” December 28, 2021.
6FactSet, “ETF Trends: Familiar Direction, but Bigger,” January 25, 2022.
7Morningstar Direct as of December 31, 2021.
Learn more about
To read the full article, become an RIA Insider. You'll also gain complimentary access to news, insights, tools and more.
Already an Insider?
©2022 Morningstar, Inc. All rights reserved. The information contained herein: (1) is proprietary to Morningstar and/or its content providers; (2) may not be copied or distributed; and (3) is not warranted to be accurate, complete or timely. Neither Morningstar nor its content providers are responsible for any damages or losses arising from any use of this information. Past performance is no guarantee of future results.
Investments are not FDIC-insured, nor are they deposits of or guaranteed by a bank or any other entity, so they may lose value.
Investors should carefully consider investment objectives, risks, charges and expenses.
This and other important information is contained in the fund prospectuses and summary prospectuses, which can be obtained from a financial professional and should be read carefully before investing.
Statements attributed to an individual represent the opinions of that individual as of the date published and do not necessarily reflect the opinions of Capital Group or its affiliates. This information is intended to highlight issues and should not be considered advice, an endorsement or a recommendation.
All Capital Group trademarks mentioned are owned by The Capital Group Companies, Inc., an affiliated company or fund. All other company and product names mentioned are the property of their respective companies.
Use of this website is intended for U.S. residents only.
American Funds Distributors, Inc.
This content, developed by Capital Group, home of American Funds, should not be used as a primary basis for investment decisions and is not intended to serve as impartial investment or fiduciary advice.