Interest Rates
Categories
Investing Strategy
2022 Outlook: Themes to bolster your client conversations
Several macro factors indicate a potentially challenging investment landscape in 2022. Valuations are elevated across asset classes, making value harder to find. And a mix of economic, policy and geopolitical risks hangs over investors, including persistent inflation, slower growth, monetary policy tightening and rising interest rates.
“Against this challenging backdrop, however, we are optimistic about an environment that is ideally suited to selective investing grounded in bottom-up, fundamental research,” says Rob Lovelace, vice chairman and president of Capital Group.
To help advisors prepare for client conversations about risk, opportunity and portfolio construction in early 2022, we identify key macro themes and zero in on specific, actionable investment themes.
KEY TAKEAWAYS
- Inflation is a key concern in 2022. One way to counterbalance the risk of inflation is to focus on companies with pricing power that can protect margins by passing costs to customers.
- Uncertainty abounds in Chinese equities, but attractive opportunities remain, especially in areas aligned with the country’s strategic priorities.
- Flexibility to move from sector to sector is key for fixed income investing in 2022, as investment-grade corporates should still provide relative resilience in an equity correction.
Several macro factors indicate a potentially challenging investment landscape in 2022. Valuations are elevated across asset classes, making value harder to find. And a mix of economic, policy and geopolitical risks hangs over investors, including persistent inflation, slower growth, monetary policy tightening and rising interest rates.
“Against this challenging backdrop, however, we are optimistic about an environment that is ideally suited to selective investing grounded in bottom-up, fundamental research,” says Rob Lovelace, vice chairman and president of Capital Group.
To help advisors prepare for client conversations about risk, opportunity and portfolio construction in early 2022, we identify key macro themes and zero in on specific, actionable investment themes. For more on Capital Group’s outlook for 2022, see our 2022 outlook overview and our deeper pieces on the U.S. outlook, international outlook and bond market outlook. Consider sharing these pieces with your clients to help set the stage for your outlook discussions.
Investment landscape: What to expect in 2022
- Extended market valuations leave little room for error
The upswing in equity prices since the 2020 downturn was simply a continuation of the long-term bull market. Other asset classes — including bonds, private equity and real estate — have also participated. Investors should be mindful of the dangers inherent in late-stage bull markets.
- High inflation should persist (although nothing like the 1970s)
Inflation should likely remain elevated through late 2022, fueled by labor shortages and broken supply chains. “Sticky” categories like rent, insurance and medical expenses should support higher prices. Inflation should normalize toward the U.S. Federal Reserve’s 2% goal, but it could take longer than expected.
- Growth in the U.S. and Europe will likely be solid, but slower
U.S. GDP growth should normalize between 2.5% and 3.0%, short of projections from the International Monetary Fund (IMF). The main European economies may be stronger, rebounding to the 4.0% to 5.0% range. However, investors should look out for potential “slowflation” — a combination of slower growth and persistent inflation.
- China’s economy could decelerate markedly
A combination of factors — including tighter credit in the real estate sector, COVID lockdowns and policy realignments — may cause China’s economy to slow sharply. Growth in China could be well below the 5.6% consensus estimate. A significant drop would drag on the world economy.
- Rate hikes and elections will likely create short-term volatility
The Fed has signaled it may start raising interest rates sometime in 2022. Rate hikes usually cause market volatility, as do U.S. elections. Historically, stocks are more volatile in the first months of midterm election years, but return to trend as polls become more predictable.
Equity themes for 2022
Pricing power and strong dividends counter inflation
Inflation is “the biggest risk investors face in 2022,” says equity portfolio manager Diana Wagner. One way to combat the risk of inflation is to focus on companies with pricing power that can protect margins by passing costs to customers. Examples include strong consumer brands (e.g., food and beverage), companies in industries with favorable supply and demand dynamics (e.g., semiconductors) and businesses providing essential services (e.g., health care and pharmaceuticals).
Dividends are also staging a comeback, notes equity portfolio manager Caroline Randall. “Because it is reflective of stronger earnings, dividend growth can also offer a measure of resilience against interest rate hikes,” Randall adds.
Pricing power counterbalances inflation
Companies with pricing power can protect margins by passing costs along to customers. High gross margins with low volatility (gray shaded section of chart) are a good proxy for stable pricing power.
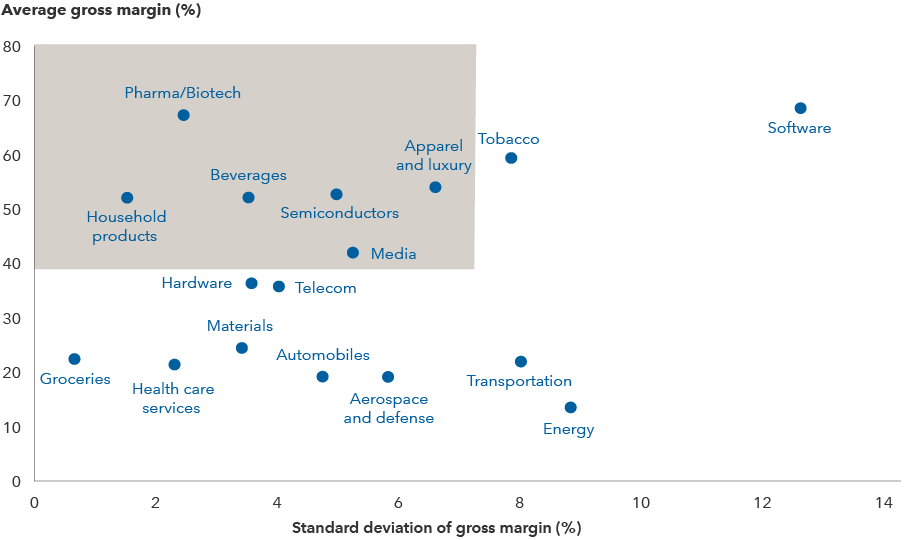
Sources: Capital Group, FactSet, MSCI. Reflects select industries within the MSCI World Index. Average and standard deviation of gross margins are calculated for the five-year period ending September 30, 2021. Average gross margin is net sales less the cost of goods sold and is shown as a percentage of net sales. Standard deviation is a common measure of absolute volatility that tells how returns over time have varied from the mean. A lower number signifies lower volatility.
Digital transformation transcends borders
The digital revolution has moved far beyond U.S. tech giants as companies around the world harness data and technology to enhance their business models. “I don’t think these opportunities are yet fully understood by the market,” says equity portfolio manager Greg Wendt. Examples abound of old-economy companies investing in automation, machine learning and other tech-based initiatives. Retailers Home Depot and Williams Sonoma are integrating brick-and-mortar stores with e-commerce. Personal care company L’Oréal in France and appliance maker Midea Group in China have ramped up digital adoption. “Some investors may think exclusively about consumer tech giants or cloud-based software providers,” says Wendt, “but at Capital Group, we dig deeper across all industries to discover companies with the potential to benefit from a digital transformation.”
Going digital
The share of e-commerce in total sales is a good marker of how advanced a company is in its digital transformation.
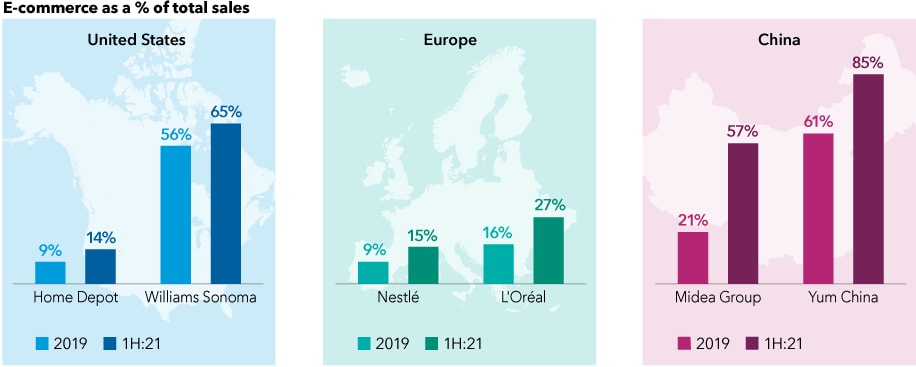
Sources: Capital Group, company filings, company reports, FactSet. For Home Depot and Williams Sonoma, the full-year period refers to the 12 months ending on January 30 to align with company’s fiscal year (i.e., 2017 = February 2017–January 2018); 1H:21 refers to the period between February 2021–July 2021. All other periods correspond with calendar years. As of July 31, 2021.
Investing in China favors selectivity
With government intervention, policy flip-flops and slowing growth, is China still investable? There is uncertainty, but attractive opportunities remain, especially in areas aligned with the country’s strategic priorities.
One such area is biopharma. “[The Chinese] authorities have been pushing policies that incentivize domestic companies to compete with global companies,” says investment analyst Laura Nelson Carney. They are seeking to improve access to quality health care and foster local firms. Venture capital has flooded in, and Chinese-born scientists are returning home after working abroad. These moves have created an environment that benefits both foreign and domestic companies.
Focusing on specific priorities in China
China’s support of its biopharma industry is fostering a favorable environment for both foreign and domestic companies.
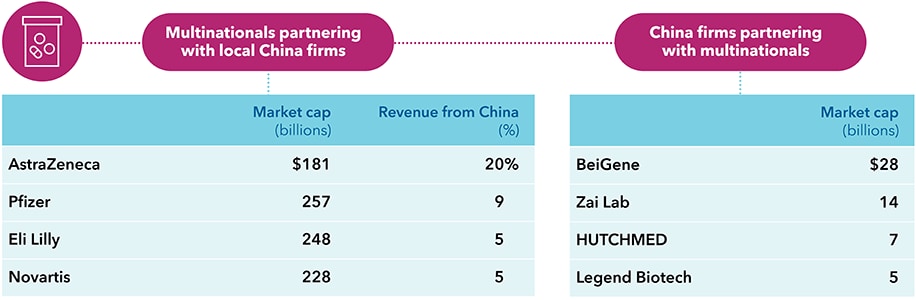
Sources: Capital Group, company filings, RIMES. Market value as of August 31, 2021. Revenue from China are approximations based on most recently available company filings as of June 30, 2021.
Fixed income themes for 2022
Maintain the core
Rate hikes are expected to begin in 2022. What do rising rates mean for bonds? Consider the last four rate-hiking periods. The core bond benchmark, the Bloomberg U.S. Aggregate Index, declined in only one of those periods and averaged a 3% return. “It is as important as ever to maintain a strong core bond allocation,” says Mike Gitlin, head of fixed income at Capital Group. Core bonds have potential to provide diversification from equities. Active managers can identify bonds that could hold up well should rates drift higher, and also tilt to Treasury Inflation-Protected Securities (TIPS) to combat rising prices.
Rising rates don’t necessarily mean falling bond prices
Over the past four periods of rate increases, the Bloomberg U.S. Aggregate Index averaged an annual return of 3%.
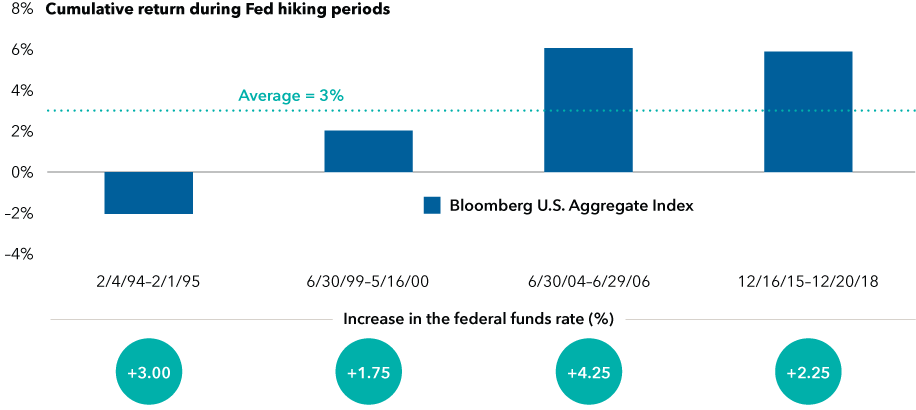
Sources: Bloomberg Index Services Ltd., Morningstar. As of November 30, 2021.
High-yield corporates may protect against rising rates
For investors concerned with rising interest rates, high-yield bonds may be a better choice than investment-grade (BBB/Baa and above) bonds. Not only are their durations lower, but their credit quality also has improved, with a tilt towards BB-rated bonds — the highest credit segment in the category. However, high-yield bonds do have more credit risk than investment-grade bonds, so they may not be appropriate for investors simply looking for diversification from equities. Flexibility to move from sector to sector is key, as investment-grade corporates still provide relative resilience in an equity correction.
Selectivity across fixed income sectors is key
With many bonds priced for perfection, selective investing is critical. Certain high-yield corporates currently offer strong defense against rising interest rates.
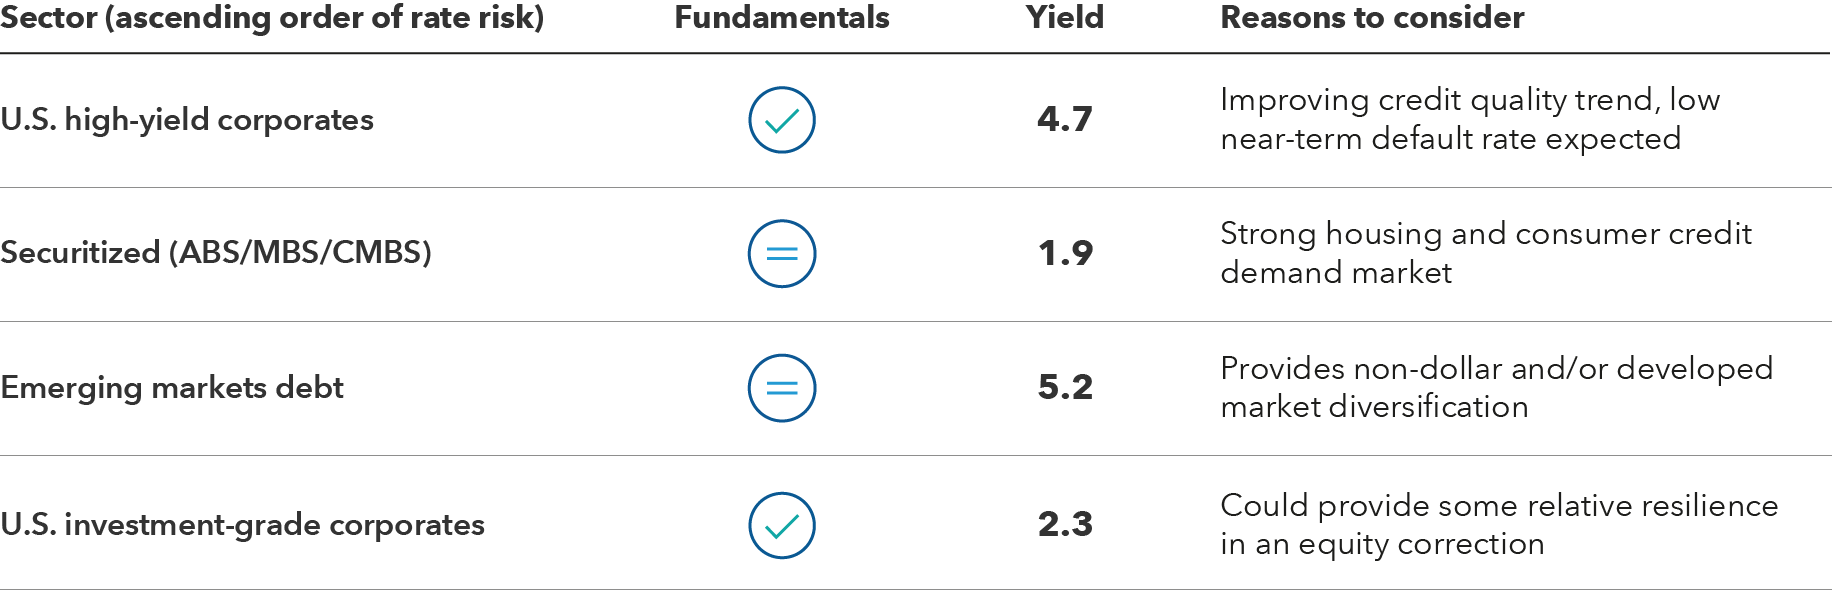
Sources: Capital Group, Bloomberg Index Services Ltd., Morningstar. As of November 30, 2021. Sectors represented by Bloomberg U.S. Corporate High Yield 2% Issuer Capped Index, Bloomberg Securitized ABS/MBS/CMBS Index, a 50%/50% blend of the JP Morgan EMBI Global/JP Morgan GBI-EM Global Diversified indexes and Bloomberg U.S. Corporate Investment Grade Index. Sectors above shown in ascending order of interest rate risk, where index durations were 4.2, 4.6, 6.6 and 8.6 years, respectively. Yield shown is yield to worst. ABS/MBS/CMBS are asset-backed securities, mortgage-backed securities and commercial mortgage-backed securities, respectively.
Strong fundamentals for municipal bonds
Whatever your view on future tax hikes may be, municipal bonds continue to offer meaningful tax-advantaged yields for investors in higher tax brackets. Strong demand and rising prices — partly due to a remarkable stimulus-fueled turnaround in the fundamentals of towns and cities — have made attractive opportunities more difficult to find. However, with bond-by-bond research, investors can still find value, and fundamentals should remain solid for the medium term. The transportation sector is a good example — some issues have yielded as high as 5%, and the sector could receive an additional boost from U.S. infrastructure spending initiatives.
Tax-equivalent boost
Strong fundamentals and market demand have made it more difficult to find value in municipal bonds, but on a selective basis they can still offer significant tax-equivalent benefits.
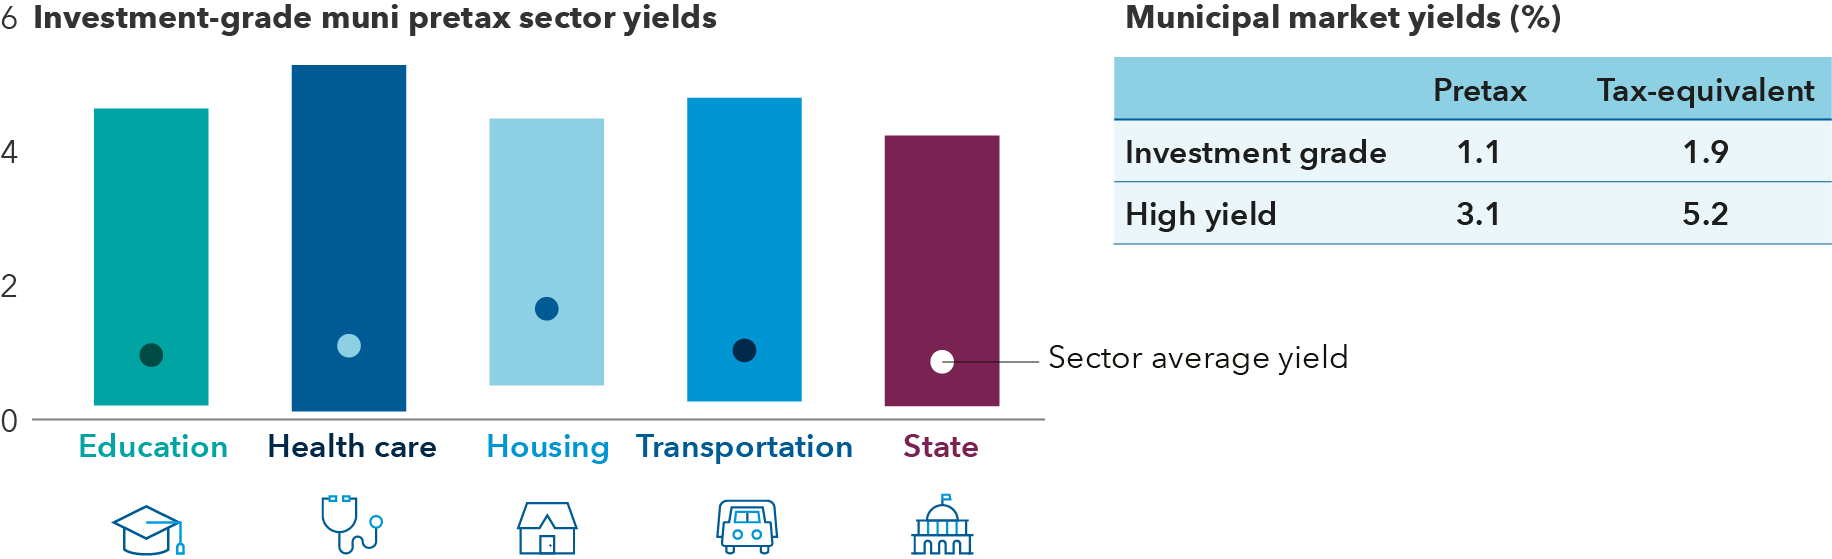
Source: Bloomberg Index Services, Ltd. As of November 30, 2021. Yield ranges and averages based on respective index sectors within the Bloomberg Municipal Bond Index. Proxies for taxable-equivalent yields: Bloomberg Municipal Bond Index (investment grade) and Bloomberg Municipal High Yield Index (high yield). Taxable-equivalent yield assumes the top federal marginal tax rate for 2021 of 37%, plus the 3.8% Medicare tax.
Start the year off on the right foot
Extended market valuations and a confluence of macro risks could make 2022 a challenging year for investors. However, there are reasons to be optimistic, including an abundance of possibilities for selective investing rooted in bottom-up, fundamental research.
As you examine your clients’ portfolios for potential areas of risk and opportunity, Capital Group’s portfolio consultants may be able to help identify specific areas to focus on. Consider scheduling a portfolio consultation with one of our specialists today.
Learn more about
To read the full article, become an RIA Insider. You'll also gain complimentary access to news, insights, tools and more.
Already an Insider?
For financial professionals only. Not for use with the public.
Investments are not FDIC-insured, nor are they deposits of or guaranteed by a bank or any other entity, so they may lose value.
Investors should carefully consider investment objectives, risks, charges and expenses.
This and other important information is contained in the fund prospectuses and summary prospectuses, which can be obtained from a financial professional and should be read carefully before investing.
Bond ratings, which typically range from AAA/Aaa (highest) to D (lowest), are assigned by credit rating agencies such as Standard & Poor's, Moody's and/or Fitch, as an indication of an issuer's creditworthiness.
There may have been periods when the results lagged the index(es) and/or average(s).
The indexes are unmanaged and, therefore, have no expenses. Investors cannot invest directly in an index.
Source: Bloomberg Index Services Limited. BLOOMBERG® is a trademark and service mark of Bloomberg Finance L.P. and its affiliates (collectively "Bloomberg"). Bloomberg or Bloomberg's licensors own all proprietary rights in the Bloomberg Indices. Neither Bloomberg nor Bloomberg's licensors approves or endorses this material, or guarantees the accuracy or completeness of any information herein, or makes any warranty, express or implied, as to the results to be obtained therefrom and, to the maximum extent allowed by law, neither shall have any liability or responsibility for injury or damages arising in connection therewith.
MSCI has not approved, reviewed or produced this report, makes no express or implied warranties or representations and is not liable whatsoever for any data in the report. You may not redistribute the MSCI data or use it as a basis for other indices or investment products.
This report, and any product, index or fund referred to herein, is not sponsored, endorsed or promoted in any way by J.P. Morgan or any of its affiliates who provide no warranties whatsoever, express or implied, and shall have no liability to any prospective investor, in connection with this report. J.P. Morgan disclaimer: https://www.jpmm.com/research/disclosures
Statements attributed to an individual represent the opinions of that individual as of the date published and do not necessarily reflect the opinions of Capital Group or its affiliates. This information is intended to highlight issues and should not be considered advice, an endorsement or a recommendation.
All Capital Group trademarks mentioned are owned by The Capital Group Companies, Inc., an affiliated company or fund. All other company and product names mentioned are the property of their respective companies.
Use of this website is intended for U.S. residents only.
American Funds Distributors, Inc.
This content, developed by Capital Group, home of American Funds, should not be used as a primary basis for investment decisions and is not intended to serve as impartial investment or fiduciary advice.
© 2024 Morningstar, Inc. All Rights Reserved. Some of the information contained herein: (1) is proprietary to Morningstar and/or its content providers; (2) may not be copied or distributed; and (3) is not warranted to be accurate, complete or timely. Neither Morningstar, its content providers nor Capital Group are responsible for any damages or losses arising from any use of this information. Past performance is no guarantee of future results. Information is calculated by Morningstar. Due to differing calculation methods, the figures shown here may differ from those calculated by Capital Group.
Investments are not FDIC-insured, nor are they deposits of or guaranteed by a bank or any other entity, so they may lose value.
Investors should carefully consider investment objectives, risks, charges and expenses.
This and other important information is contained in the fund prospectuses and summary prospectuses, which can be obtained from a financial professional and should be read carefully before investing.
All Capital Group trademarks mentioned are owned by The Capital Group Companies, Inc., an affiliated company or fund. All other company and product names mentioned are the property of their respective companies.
Use of this website is intended for U.S. residents only.
American Funds Distributors, Inc.
This content, developed by Capital Group, home of American Funds, should not be used as a primary basis for investment decisions and is not intended to serve as impartial investment or fiduciary advice.