Technology & Innovation
Categories
Fed
Why R-star may rise, and its implications for rates and policy
 Jared Franz
June 21, 2023
After lifting the key interest rate by 5 percentage points in a little more than a year, the Fed may be nearing the end of its monetary tightening cycle. Markets are already pricing in rate cuts for next year. And while the central bank may begin to bring down the federal funds rate in the face of an economic slowdown or outright recession, markets may be overestimating by how much.
I believe the era of ultra-low interest rates may be over, and one likely driver is an important theoretical underpinning of monetary policy: the neutral rate of interest, better known by its nickname, R-star. A higher R-star would have important economic, monetary policy and financial market implications.
Markets may be overestimating a Fed retreat
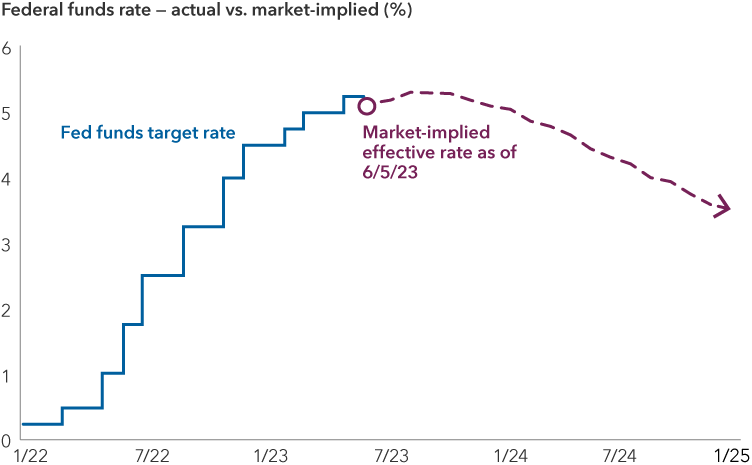
Sources: Capital Group, FactSet, U.S. Federal Reserve. The federal funds rate reflects the upper bound of the Federal Open Market Committee's target range for overnight lending among U.S. banks. Data as of June 5, 2023.
A rising star in monetary policy?
By definition, R-star is the real interest rate that is neither expansionary nor contractionary when the economy is at full employment. If the central bank sets its policy rate below R-star, then its monetary policy position is accommodative. In other words, the level of real interest rates relative to R-star is how the Fed judges the extent to which monetary policy may be stimulating, slowing down or having no notable impact on the economy and financial markets.
R-star can change. Factors such as the composition of the workforce, labor productivity, investment and innovation affect its level, because they impact how fast an economy can grow without causing inflation. For example, higher productivity or more capital investment should give an economy the capacity to grow faster without sparking inflation.
The Fed currently believes R-star is about 0.5%, which is significantly lower than the Fed’s calculation of 2% a decade ago.
In the past, a low R-star has meant the Fed could keep its policy rate lower without worrying about stoking inflation. At the same level of inflation, the impact on the economy of a 2% fed funds rate and 1% R-star should be similar to that of a 1.5% fed funds rate and a 0.5% R-star. In both cases, the spread between the two rates is 1%.
There are a number of economic factors that affect R-star, but I believe the net result over the medium term is a higher neutral rate. I can see R-star reaching 1% to 2% in the next three years.
1. Demographic dynamics may be changing
Demographics affect real rates by what they do to growth, savings and capital investment trends. Traditional wisdom says as life expectancy rises and traditional social safety nets remain uncertain, workers will save more. Also, retirees may spend less early on, as they expect to live longer.
More savings and less spending can translate into slower growth and lead to less capital investment. With these dynamics at play, demographics have pushed R-star down over the last 40 years.
But we may be approaching a turning point. The U.S. and other developed nations are shifting from aging populations to old populations. About 17% of Americans are over 65 years old, and that number is expected to hit 21% by 2030. But as people keep aging, they eventually save less, and they spend more on nursing, hospitals, specialized housing and other needs.
The U.S. population is getting older
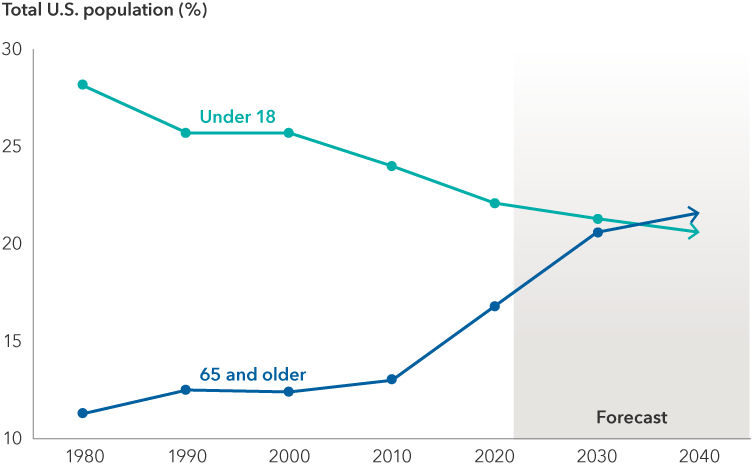
Source: U.S. Census Department. Data as of January 1, 2021.
Moreover, as older generations represent a greater percentage of the voting population — and they are typically more likely to vote — they are likely to support protection of social safety nets.
This could result in demographic forces that halt or even lower savings while stimulating investment in select parts of the economy, which would be supportive of a higher R-star.
2. Government spending is expected to increase
Government spending and debt play an important role. Essentially, by borrowing on public expenditures, the government takes household savings and spends it, which tends to push up real rates.
A general rule of thumb is that a percentage point increase in federal debt to gross domestic product (GDP) can help push up R-star by three basis points. Over the past decade, U.S. government debt held by the public has grown from 70% of GDP in 2012 to 97% in 2022, equating roughly to an 80 basis point increase in R-star.
I expect debt-to-GDP to continue rising. Federal debt held by the public will reach 118% of GDP in a decade, according to estimates from the Congressional Budget Office (CBO). The recent debt ceiling agreement focused on discretionary spending for the next two years, hence it should not have a significant impact on the estimate.
The biggest drivers of federal spending and the expanding debt are entitlement programs tied closely to an aging population, namely social security and Medicare and increasing interest payments on that debt. Spending on those three items alone came to 9.5% of GDP in 2022, and the CBO expects it to reach 13.7% in 2033.
3. Capital investment in factories, warehouses, supply chains will likely rise
Much of the period following the global financial crisis has been marked by investments in technology, particularly in areas such as software and automation. But in the post-COVID era, we’ve seen a sharp shift in the macro-political dynamics, which could contribute to a higher R-star.
The pandemic, U.S.-China tensions and the Russia-Ukraine war have put a new emphasis on building reliable supply chains and ensuring national self-sufficiency. Companies are looking to shift operations closer to end markets or add redundancy. This could unleash a new wave of capital investment in physical infrastructure, from industrial warehouses and state-of-the-art factories to cold storage facilities and transportation.
Climate change is spurring companies to create multi-pronged sourcing strategies to avoid dependence on manufacturing from a single state, country or region. The devastation that storms, floods and fires bring also requires extensive public and private investment in rebuilding. In other words, while more climate-related events hurt economic activity, the investment response could more than offset it.
Another likely boost to infrastructure spending will likely come from the transition to newer and greener energy sources. By 2030, total energy investment could rise to $4 trillion (based on current green energy pledges) or $5 trillion (based on estimates of what’s needed to achieve net zero emissions). Overall, investments of such magnitude should lead to a net upward pressure on real interest rates.
An energy investment boom may be coming
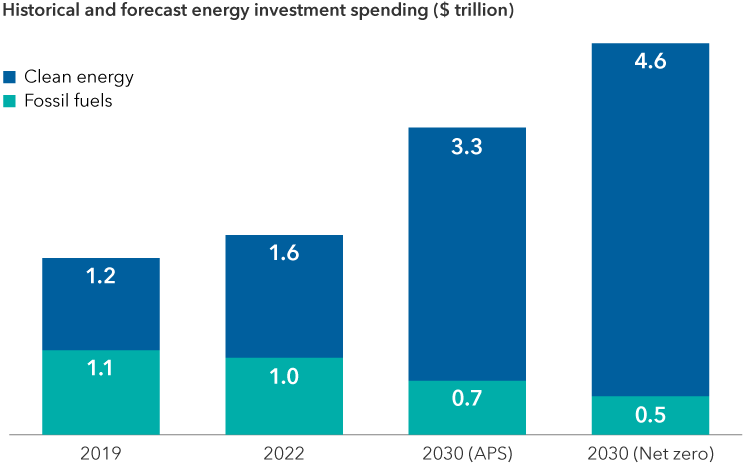
Source: International Energy Agency. Data as of June 5, 2023. 2030 values are forecasts. APS = the announced pledges scenario that assumes all climate commitments and net zero targets made by governments around the world will be met in full and on time. Net zero = a scenario that sets out a narrow but achievable pathway for the global energy sector to achieve net zero CO2 emissions by 2050.
4. A productivity boost may be coming
Productivity trends move over long cycles of 10 or even 20 years. Following the global financial crisis, the U.S. economy experienced a marked downshift in productivity growth, capped off by outright declines in the wake of the pandemic. But we may be entering a secular period of technology-driven gains.
Productivity has been in a slump
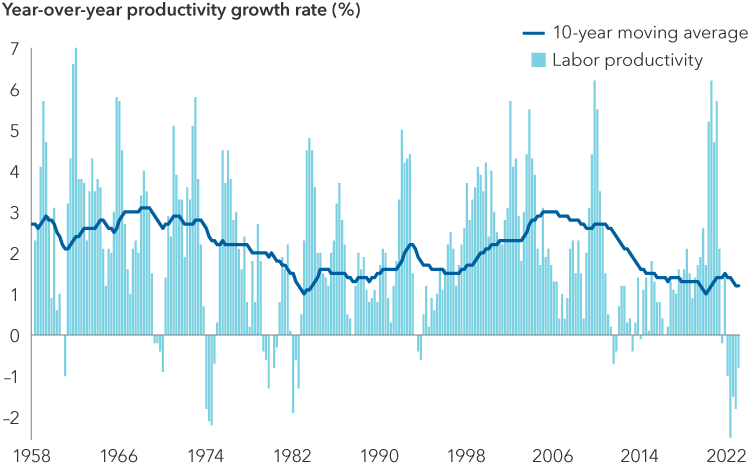
Sources: Capital Group, Bureau of Labor Statistics. Data as of April 1, 2023.
The rise of generative artificial intelligence (AI) such as ChatGPT is starting to automate processes so that workers can be more productive. I see this as the early stage of a profound change that should improve worker capacity, which could boost the ability to achieve a higher level of GDP growth without driving up inflation. The benefits of applying AI should tend to dampen R-star. On the other hand, the rise of AI and other technologies may require greater investment, which should motivate broader investment in the industries that expand their share of the economy by utilizing these innovations. By some estimates, global spending on AI-related hardware, software and services will reach about $154 billion this year and could top $300 billion by 2026. Every dollar of investment helps contribute to a higher R-star.
Direct investment may include purchasing more microchips and cloud computing hardware. There will likely be demand for more powerful and efficient chips, which would drive investment in production facilities. Broader investment could include robots for warehouses and new electric car factories.
Given how cloud computing and smartphones led to unanticipated opportunities, I believe businesses will feel compelled to investigate and invest in AI. As companies improve operations and gain competitive advantages, they could stimulate further investment.
What a rising R-star implies for policy and markets
A rising neutral rate isn’t likely to preclude the Fed from cutting interest rates in the near term if inflation keeps easing or the U.S. economy enters a recession.
However, markets may be overestimating how far it goes. The Fed has been signaling it wants to move away from ultra-low rates and reserve quantitative easing for real economic emergencies. Any indications that R-star may be rising would make it even harder to justify aggressive rate cuts.
A higher R-star would broadly lead to higher market interest rates. That in turn implies a higher risk-free rate against which all financial assets are benchmarked, including equities, broader fixed income and real return assets. An R-star between 1% and 2% with inflation returning to the Fed’s 2% target rate would imply the nominal fed funds rate ends up in a 3% to 4% range.
A shift in R-star would also move the equilibrium of equity valuations. A company trading at a P/E ratio around 20 in an ultra-low rate environment with an R-star of 0% to 0.5% would likely trade around 18 in a higher rate environment with an R-star of 1% to 2%.
Overall, I expect risk premiums to rise across equities that include growth stocks and interest-rate-sensitive, dividend-paying equities.
Learn more about
For financial professionals only. Not for use with the public.
Investments are not FDIC-insured, nor are they deposits of or guaranteed by a bank or any other entity, so they may lose value.
Investors should carefully consider investment objectives, risks, charges and expenses.
This and other important information is contained in the fund prospectuses and summary prospectuses, which can be obtained from a financial professional and should be read carefully before investing.
Bond ratings, which typically range from AAA/Aaa (highest) to D (lowest), are assigned by credit rating agencies such as Standard & Poor's, Moody's and/or Fitch, as an indication of an issuer's creditworthiness.
There may have been periods when the results lagged the index(es) and/or average(s).
The indexes are unmanaged and, therefore, have no expenses. Investors cannot invest directly in an index.
Source: Bloomberg Index Services Limited. BLOOMBERG® is a trademark and service mark of Bloomberg Finance L.P. and its affiliates (collectively "Bloomberg"). Bloomberg or Bloomberg's licensors own all proprietary rights in the Bloomberg Indices. Neither Bloomberg nor Bloomberg's licensors approves or endorses this material, or guarantees the accuracy or completeness of any information herein, or makes any warranty, express or implied, as to the results to be obtained therefrom and, to the maximum extent allowed by law, neither shall have any liability or responsibility for injury or damages arising in connection therewith.
MSCI has not approved, reviewed or produced this report, makes no express or implied warranties or representations and is not liable whatsoever for any data in the report. You may not redistribute the MSCI data or use it as a basis for other indices or investment products.
This report, and any product, index or fund referred to herein, is not sponsored, endorsed or promoted in any way by J.P. Morgan or any of its affiliates who provide no warranties whatsoever, express or implied, and shall have no liability to any prospective investor, in connection with this report. J.P. Morgan disclaimer: https://www.jpmm.com/research/disclosures
Statements attributed to an individual represent the opinions of that individual as of the date published and do not necessarily reflect the opinions of Capital Group or its affiliates. This information is intended to highlight issues and should not be considered advice, an endorsement or a recommendation.
All Capital Group trademarks mentioned are owned by The Capital Group Companies, Inc., an affiliated company or fund. All other company and product names mentioned are the property of their respective companies.
Use of this website is intended for U.S. residents only.
American Funds Distributors, Inc.
This content, developed by Capital Group, home of American Funds, should not be used as a primary basis for investment decisions and is not intended to serve as impartial investment or fiduciary advice.
© 2024 Morningstar, Inc. All Rights Reserved. Some of the information contained herein: (1) is proprietary to Morningstar and/or its content providers; (2) may not be copied or distributed; and (3) is not warranted to be accurate, complete or timely. Neither Morningstar, its content providers nor Capital Group are responsible for any damages or losses arising from any use of this information. Past performance is no guarantee of future results. Information is calculated by Morningstar. Due to differing calculation methods, the figures shown here may differ from those calculated by Capital Group.
Investments are not FDIC-insured, nor are they deposits of or guaranteed by a bank or any other entity, so they may lose value.
Investors should carefully consider investment objectives, risks, charges and expenses.
This and other important information is contained in the fund prospectuses and summary prospectuses, which can be obtained from a financial professional and should be read carefully before investing.
Investing outside the United States involves risks, such as currency fluctuations, periods of illiquidity and price volatility. These risks may be heightened in connection with investments in developing countries.
The value of fixed income securities may be affected by changing interest rates and changes in credit ratings of the securities.
Statements attributed to an individual represent the opinions of that individual as of the date published and do not necessarily reflect the opinions of Capital Group or its affiliates. This information is intended to highlight issues and should not be considered advice, an endorsement or a recommendation.
All Capital Group trademarks mentioned are owned by The Capital Group Companies, Inc., an affiliated company or fund. All other company and product names mentioned are the property of their respective companies.
Use of this website is intended for U.S. residents only.
American Funds Distributors, Inc.
This content, developed by Capital Group, home of American Funds, should not be used as a primary basis for investment decisions and is not intended to serve as impartial investment or fiduciary advice.