Technology & Innovation
Categories
Markets & Economy
5 keys to investing in 2022
 Rob Lovelace
 Diana Wagner
 Mike Gitlin
January 7, 2022
The wall of worry that markets and investors face every year only seems to be getting taller and wider heading into 2022. There are the known challenges: How long will inflation last? Will central banks raise rates? How will a slowing Chinese economy impact global growth?
There also are unknown shocks and surprises that likely await investors in the year ahead. But smart investors can take action to prepare for the unexpected. Here are five keys to staying on course in 2022 amid economic and geopolitical uncertainty:
1. Prepare for higher volatility
What a difference a year makes. At the start of 2021, investors cheered the approval of several COVID vaccines and the rollout of massive government stimulus to bolster economies and markets.
Heading into 2022, COVID case counts are soaring, inflation is hitting new highs and the U.S. Federal Reserve has indicated it could raise rates three times in the coming year.
While such developments can be unnerving, it’s important to keep them in perspective. “The pandemic will likely be with us a long time, if not forever, but over time I expect its impact on the economy and markets will diminish,” says Rob Lovelace, vice chair and president of Capital Group.
Another likely source of volatility over the next 12 months: the upcoming U.S. midterm elections. Political uncertainty often has a noticeable impact on markets, but that impact has tended to be short term. “I don’t think this year will be any different,” says equity portfolio manager Chris Buchbinder. “There may be a few bumps in the road — and investors should brace for short-term volatility — but I don’t think the destination will change.”
Indeed, an analysis of more than 90 years of equity returns reveals that stocks tend to have lower average returns and higher volatility for the first several months of midterm election years. As results at the polls become more predictable, this trend often reverses, and markets have tended to return to their normal upward trajectory.
Uncertainty, whether political or economic, generates a lot of noise. Smart investors would be wise to look past the short-term highs and lows and stay the course.
Prepare for market volatility this midterm election year
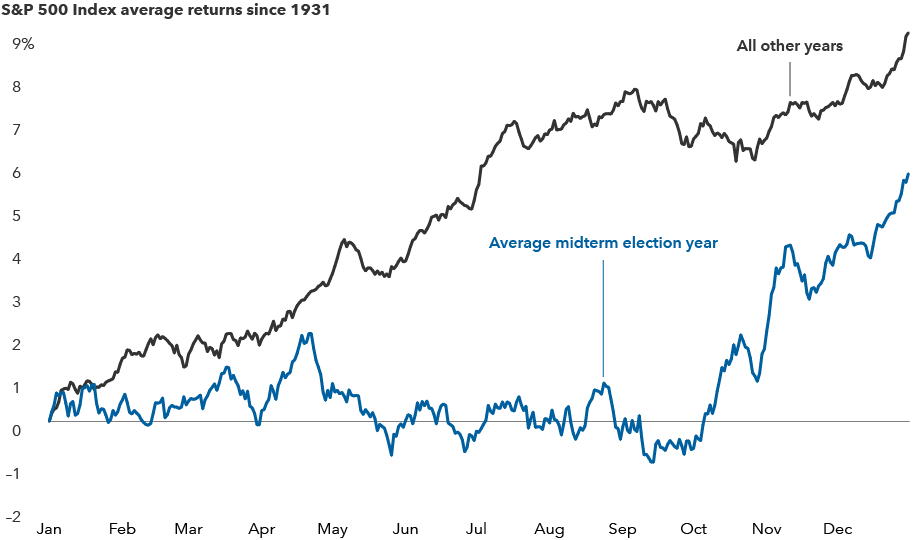
Sources: Capital Group, RIMES, Standard & Poor’s. The chart shows the average trajectory of equity returns throughout midterm election years compared to non-midterm election years. Each point on the lines represents the average year-to-date return as of that particular month and day and is calculated using daily price returns from 1/1/31–12/31/21.
2. To fight inflation, add pricing power to your portfolio
Evidence is mounting that inflation will stick around in 2022. In November, the Consumer Price index, a broad measure of inflation, rose at its fastest rate in nearly 40 years.
“Though inflation will likely normalize within a few years, I do expect COVID and related supply chain issues to dominate the inflation outlook over the next 12 months,” says U.S. economist Darrell Spence.
To blunt inflation’s impact, investors can seek companies with pricing power. Pricing power can help protect a company’s profit margins by passing rising costs along to customers.
High and stable margins can be an indication of pricing power. Companies with pricing power potential include consumer businesses with strong brand recognition, like beverage makers Keurig Dr Pepper and Coca-Cola; companies in industries with favorable supply and demand dynamics, like semiconductor and chip equipment makers Taiwan Semiconductor Manufacturing Company and ASML; and businesses that provide essential services, like health care giants Pfizer and UnitedHealth Group.
“I believe lingering inflation may be the biggest risk companies and investors face in 2022,” says equity portfolio manager Diana Wagner. “That’s why I am so focused on uncovering companies with pricing power.”
Pricing power can help companies fight inflation
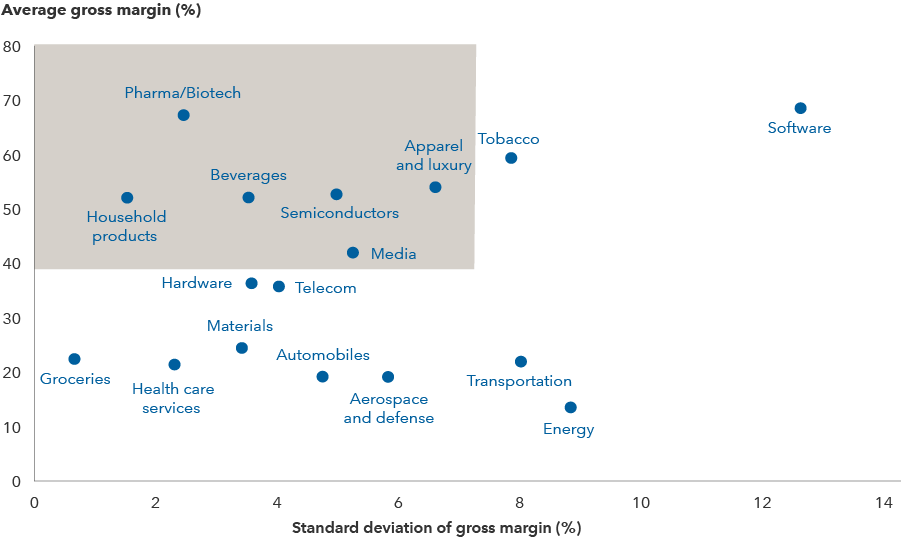
Sources: Capital Group, FactSet, MSCI. Reflects industries within the MSCI World Index. Average and standard deviation of gross margins are calculated for the five-year period ended 9/30/21. Average gross margin is net sales less the cost of goods sold and is shown as a percentage of net sales. Standard deviation is a common measure of absolute volatility that tells how returns over time have varied from the mean. A lower number signifies lower volatility.
3. Go global to tap into the digital revolution
Sure, U.S. stock markets have outpaced the rest of the world for much of the past decade, partly because many of the leaders of the digital revolution have been U.S. tech giants. But the outlook for international stock markets is brighter than it’s been in a long time, thanks to improving European economic growth and the expansion of the digital revolution beyond U.S. shores.
Indeed, the digital shift has moved far beyond the turf of Amazon, Google and Microsoft. Across nearly all industries, companies are adopting new technology to improve business and transform the way we live.
“I don’t think these opportunities are yet fully understood by the market,” says equity portfolio manager Greg Wendt. “In addition, there’s no question that valuations are lower for many international and emerging markets companies compared to their U.S. counterparts. That makes non-U.S. markets a very attractive hunting ground.”
Global spending on digital transformation is expected to rise from $1.3 trillion in 2020 to $2.4 trillion by 2024, according to Statista. Even old economy companies are investing heavily in technology to reinvent and revitalize their businesses through automation, cyber sales and machine learning.
In Europe, companies like food giant Nestlé and cosmetics leader L’Oréal have ramped up their digital adoption, nearly doubling e-commerce-related revenues as a percentage of total revenue in recent years. China is even further ahead in many ways: Companies like appliance maker Midea Group and restaurant firm Yum China have generated significantly stronger growth in e-commerce revenues.
Beyond big tech: The digital revolution spreads overseas
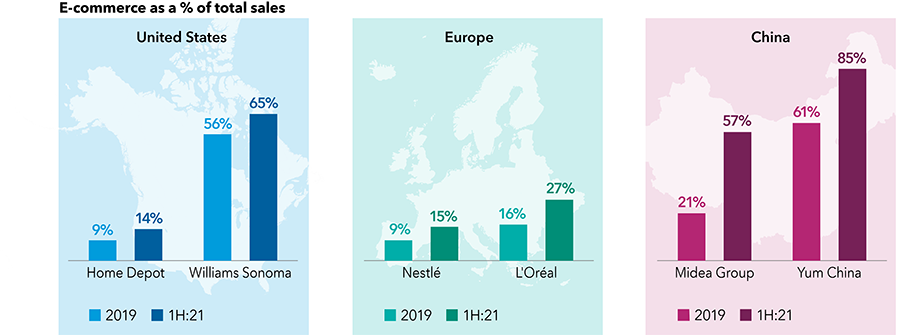
Sources: Capital Group, company filings, company reports, FactSet. For Home Depot and Williams Sonoma, the full-year period refers to the 12 months ending on January 30 to align with the company’s fiscal year (i.e., 1H:21 refers to the period between February 2021–July 2021). All other periods correspond with calendar years. As of July 31, 2021.
4. Strengthen your core bond allocation to help counter volatility
Does the prospect of rising rates bode poorly for core bond portfolios? Not necessarily, says Capital Group head of fixed income Mike Gitlin.
“The Fed’s intent to hike rates is well telegraphed, and with growth slowing, the central bank will likely move at a measured pace,” Gitlin says. “With that in mind, it still makes sense to maintain an allocation to core bonds.”
Indeed, core bonds held up well the last seven hiking periods. The core bond benchmark, the Bloomberg U.S. Aggregate Index, declined in only two of those periods and averaged a nearly 4% return. Those two periods, with low single-digit losses, were also a far cry from the double-digit corrections stocks often experience.
Core bond funds should provide a critical function in a balanced portfolio. First, they can offer diversification from equities. That is especially important at a time when the stock market is hitting new highs and volatility is rising.
Uncertainties, such as slowing global growth, an unknown COVID trajectory and a weaker Chinese economy, could result in heightened volatility. Active core bond managers can work to identify bonds with maturities that could hold up relatively well should rates drift higher.
Bonds have done well in rising rate environments
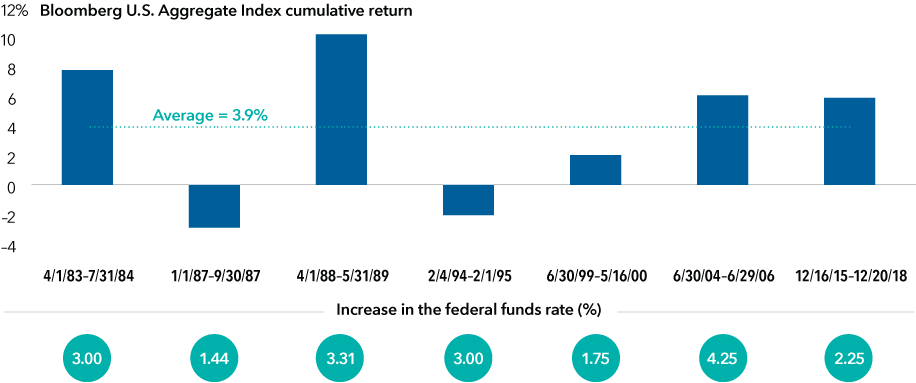
Sources: Bloomberg Index Services Ltd., Morningstar. As of 11/30/21. Daily results for the index are not available prior to 1994. For those earlier periods, returns were calculated from the closest month-end to the day of the first hike through the closest month-end to the day of the final hike.
5. Diversification still matters, so maintain a balanced portfolio
Today, with valuations for most types of financial assets far from cheap and volatility rising, investors may be thinking of moving to cash. But they should remember that well-diversified portfolios like the one in the chart below would have held up well amid shifting market conditions.
The chart illustrates a hypothetical scenario representing three types of investors. Each year, a momentum-driven investor buys the top returning asset class from the previous year. A value-seeking investor buys the lowest returning asset class. A third investor sticks to a 60/40 balance between diversified stock and bond portfolios and rebalances at year-end. In nearly every multi-year holding period over the last 20 years, the balanced portfolio would have outpaced the other two, often by a wide margin.
Balanced portfolios would have outpaced other strategies over the last 20 years
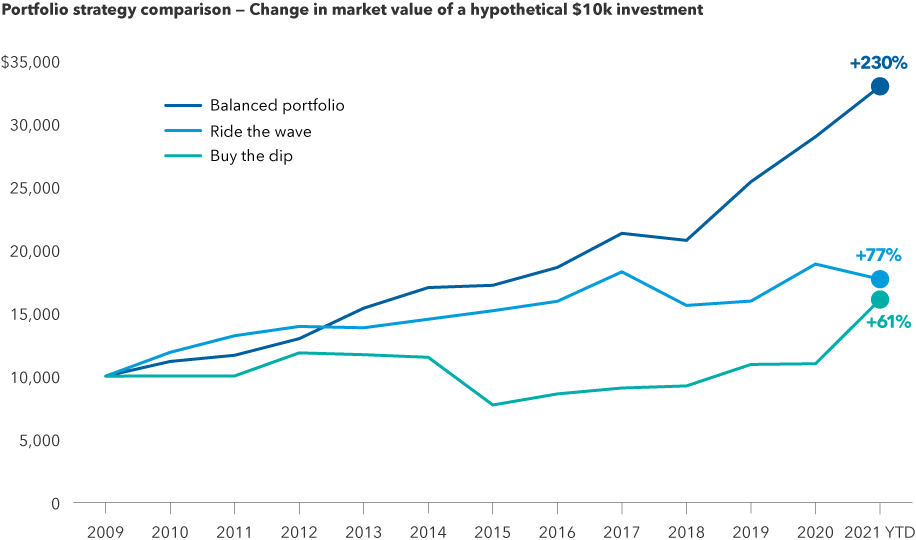
Sources: Capital Group, Bloomberg Index Services Ltd., FTSE Russell, ICE Benchmark Administration Ltd., MSCI, Refinitiv Datastream, Standard & Poor's. As of October 31, 2021. "Buy the dip" strategy represents buying the prior year's worst performing asset class every year. "Ride the wave" strategy represents buying the prior year's best performing asset class every year. "Balanced portfolio" strategy represents maintaining a 60/40 split between U.S. large cap stocks and U.S. aggregate bonds. Asset classes included in the analysis: cash (Bloomberg 1–3 Month U.S. Treasury Bill Index), developed international stocks (MSCI EAFE Index), emerging markets stocks (MSCI Emerging Markets Index), foreign bonds (Bloomberg Global Aggregate Index), global commodities (S&P GSCI), gold (LBMA Gold), U.S. equity REITs (FTSE USA REIT), U.S. high-yield bonds (Bloomberg U.S. Corporate High Yield Index), U.S. aggregate bonds (Bloomberg U.S. Aggregate Index), U.S. large cap stocks (S&P 500 Index), U.S. small cap stocks (Russell 2000), U.S. taxable municipal bonds (Bloomberg Taxable Municipal Bond Index).
The bottom line for investors
“Looking at the year ahead, the risks are clear: Inflation is rising, central banks will likely raise rates and growth is slowing,” says Lovelace. “But I am optimistic about an environment that is ideally suited to selective investing grounded in bottom-up, fundamental research.”
Learn more about
Investing outside the United States involves risks, such as currency fluctuations, periods of illiquidity and price volatility, as more fully described in the prospectus. These risks may be heightened in connection with investments in developing countries. Small-company stocks entail additional risks, and they can fluctuate in price more than larger company stocks.
The return of principal for bond funds and for funds with significant underlying bond holdings is not guaranteed. Fund shares are subject to the same interest rate, inflation and credit risks associated with the underlying bond holdings. Lower rated bonds are subject to greater fluctuations in value and risk of loss of income and principal than higher rated bonds. Income from municipal bonds may be subject to state or local income taxes and/or the federal alternative minimum tax.
The market indexes are unmanaged and, therefore, have no expenses. Investors cannot invest directly in an index.
Bloomberg U.S. Aggregate Bond Index represents the U.S. investment-grade fixed-rate bond market. Bloomberg Global Aggregate Bond Index represents the global investment-grade fixed-rate bond market. Bloomberg U.S. Corporate High Yield Index covers the universe of fixed-rate, non-investment-grade debt. Bloomberg 1–3 Month U.S. Treasury Bill Index is designed to measure the performance of public obligations of the U.S. Treasury that have a remaining maturity of greater than or equal to 1 month and less than 3 months. Bloomberg Taxable Municipal Bond Index is a market value-weighted index designed to represent the long-term investment-grade taxable municipal bond market.
FTSE USA REIT Index represents the market for U.S.-based real estate investment trust (REIT) companies.
LBMA Gold Price represents the global benchmark spot prices for unallocated gold delivered in London and is administered independently by ICE Benchmark Administration.
MSCI EAFE (Europe, Australasia, Far East) Index is a free float-adjusted market capitalization-weighted index designed to measure developed equity market results, excluding the United States and Canada. MSCI Emerging Markets Index is a free float-adjusted market capitalization-weighted index designed to measure equity market results in the global emerging markets, consisting of more than 20 emerging market country indexes. MSCI World Index is a free float-adjusted market capitalization-weighted index designed to measure equity market results of developed markets.
Russell 2000 Index measures the performance of 2,000 small cap stocks.
Standard & Poor’s 500 Composite Index is a market capitalization-weighted index based on the results of approximately 500 widely held common stocks.
S&P GSCI is a broad-based production-weighted index of the global commodities market.
BLOOMBERG® is a trademark and service mark of Bloomberg Finance L.P. and its affiliates (collectively “Bloomberg”). Bloomberg or Bloomberg’s licensors own all proprietary rights in the Bloomberg Indices. Neither Bloomberg nor Bloomberg’s licensors approves or endorses this material, or guarantees the accuracy or completeness of any information herein, or makes any warranty, express or implied, as to the results to be obtained therefrom and, to the maximum extent allowed by law, neither shall have any liability or responsibility for injury or damages arising in connection therewith.
London Stock Exchange Group plc and its group undertakings (collectively, the “LSE Group”). © LSE Group 2022. FTSE Russell is a trading name of certain of the LSE Group companies. FTSE® and Russell® indexes are trademarks of the relevant LSE Group companies and are used by any other LSE Group company under license. All rights in the FTSE Russell indexes or data vest in the relevant LSE Group company which owns the index or the data. Neither LSE Group nor its licensors accept any liability for any errors or omissions in the indexes or data and no party may rely on any indexes or data contained in this communication. No further distribution of data from the LSE Group is permitted without the relevant LSE Group company’s express written consent. The LSE Group does not promote, sponsor or endorse the content of this communication.
Source: Morningstar, Inc. © 2022 All rights reserved. The information contained herein: (1) is proprietary to Morningstar and/or its content providers; (2) may not be copied or distributed; (3) does not constitute investment advice offered by Morningstar; and (4) is not warranted to be accurate, complete or timely. Neither Morningstar nor its content providers are responsible for any damages or losses arising from this information. Past performance is no guarantee of future results.
MSCI has not approved, reviewed or produced this report, makes no express or implied warranties or representations and is not liable whatsoever for any data in the report. You may not redistribute the MSCI data or use it as a basis for other indices or investment products.
The Standard & Poor’s 500 Composite Index is a product of S&P Dow Jones Indices LLC and/or its affiliates and has been licensed for use by Capital Group. Copyright © 2022 S&P Dow Jones Indices LLC, a division of S&P Global, and/or its affiliates. All rights reserved. Redistribution or reproduction in whole or in part are prohibited without written permission of S&P Dow Jones Indices LLC.
Investments are not FDIC-insured, nor are they deposits of or guaranteed by a bank or any other entity, so they may lose value.
Investors should carefully consider investment objectives, risks, charges and expenses.
This and other important information is contained in the fund prospectuses and summary prospectuses, which can be obtained from a financial professional and should be read carefully before investing.
Statements attributed to an individual represent the opinions of that individual as of the date published and do not necessarily reflect the opinions of Capital Group or its affiliates. This information is intended to highlight issues and should not be considered advice, an endorsement or a recommendation.
All Capital Group trademarks mentioned are owned by The Capital Group Companies, Inc., an affiliated company or fund. All other company and product names mentioned are the property of their respective companies.
Use of this website is intended for U.S. residents only.
American Funds Distributors, Inc.
This content, developed by Capital Group, home of American Funds, should not be used as a primary basis for investment decisions and is not intended to serve as impartial investment or fiduciary advice.