Retirement Income
 Samir Mathur
 Eugene Han
- Retirement-age expectations aren’t matching reality, with potential consequences for ideal contribution rates and asset allocations.
- Plan sponsors should be aware of how preferences can differ around things like withdrawal strategies and ending portfolio balance.
- These findings underscore the importance of participant education to maximize the benefit of multi-asset solutions in retirement.
Issues around retirement income have been popular lately, and for good reason: Financial professionals, including plan sponsors and advisors, seek to better understand the wants and needs of a growing cohort of investors and participants who are entering or approaching their retirement spending years. To help inform our understanding around these and similar issues, we recently surveyed thousands of investors and hundreds of financial professionals.
This article summarizes some of the findings of that survey,* which revealed a surprising gap between expectations and reality, investors and advisors, and current and future retirees on a number of issues. These findings and insights are part of an ongoing program of research into retirement-income trends and spending patterns.
At a high level, the survey results reveal that there is no single solution or set of preferences for retirement. Opinions vary around preferred withdrawal rates, planning periods and sources of retirement income, and creating opportunities for advisors and plan sponsors to educate and inform their investors and participants to drive better decision-making, especially since expectations and reality don‘t always match. Three themes emerged within the findings, which we cover below.
Retirement age expectations versus reality
Distribution of actual and planned retirement age
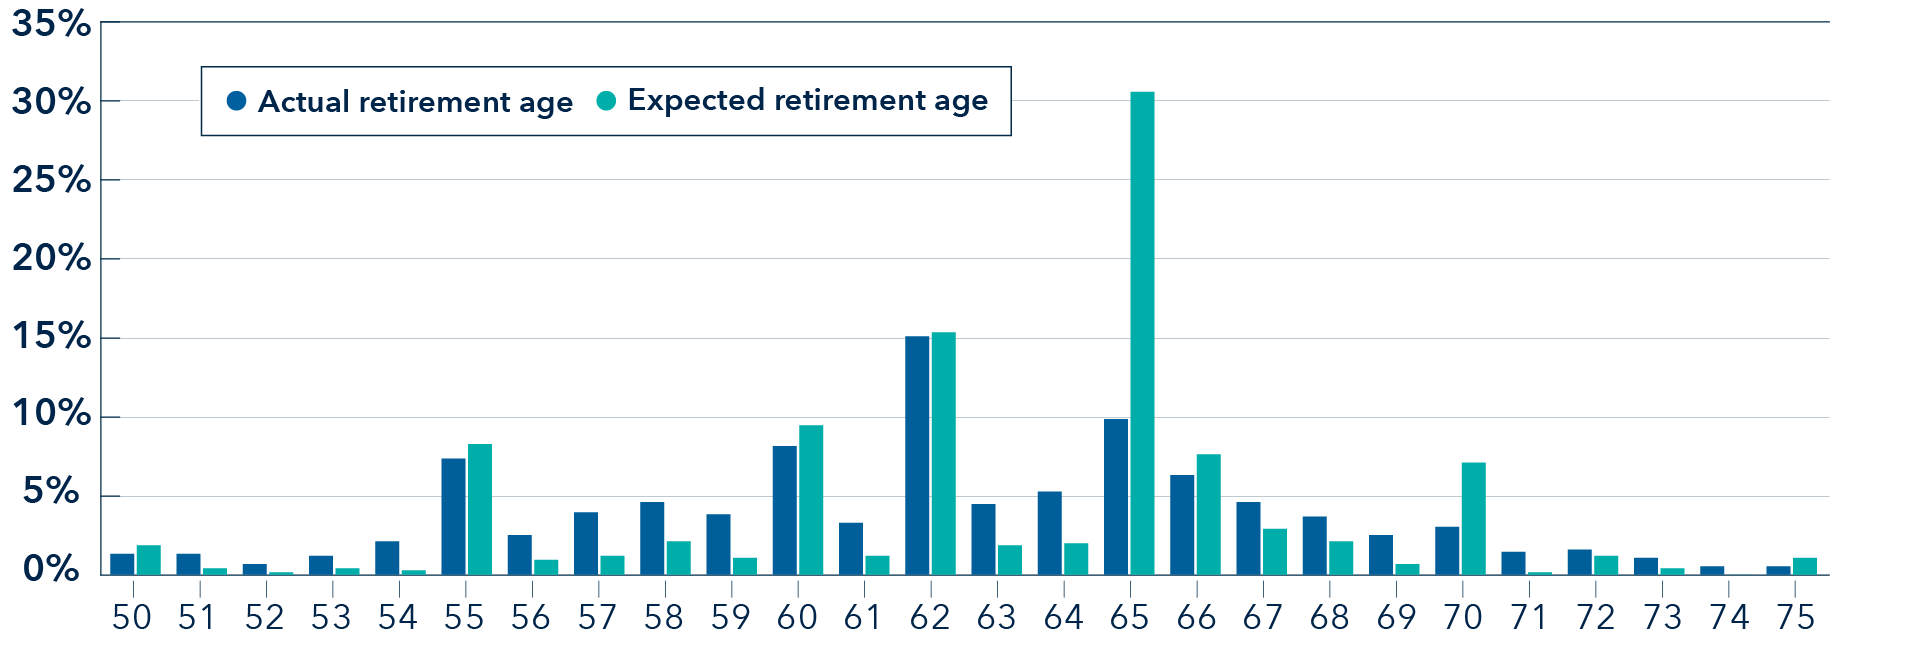
Source: Capital Group
The survey found that investors tended to retire earlier than they had expected, and early retirees had less accumulated wealth than those who were planning to retire or did retire later. This suggests that early retirement was often driven by factors other than abundant wealth.
The distribution among the investors who responded reflected that the expected retirement age was approximately three years later than retirees’ actual age. While expectations anchored on a few specific ages related to early claims on Social Security† (62) and traditional retirement ages‡ (65), the reality reflects that retirement occurs along a spectrum of ages between 50 and 70, with a focus on age 62. This gap between retirement age expectations and reality has been persistent, as reflected in Gallup‘s annual Economy and Personal Finance survey.§ And the gap has been maintained amid a secular trend of people working for longer overall. ‡
This suggests that investors and participants should reconsider their contribution rates and asset allocations during accumulation to account for this disparity.
Retirement preferences vary
Feature preferences (% of respondents)

Source: Capital Group. Percentages do not total to 100% due to “select all” options. Refer to Appendix for Capital Group investors DCM simulator (feature preferences).
When analyzing these three features preferred by investors in a retirement portfolio (ending account value, years of withdrawal, and tolerance for account balance loss), investors tended to favor account balance retention over higher withdrawal power and greater retirement income. Among wealthy retired investors, for example, the most preferred outcome was maintaining 100% ending account balance, with a tolerance for 15% balance loss during periods of market stress, the combination of which corresponds to a lower annual withdrawal rate. This willingness to take lower withdrawal for the sake of capital preservation challenges the “4% rule” — a popular retirement withdrawal strategy that suggests retirees can safely withdraw 4% of their savings annually and adjust for inflation for 30 years post-retirement — that has long been a mainstream retirement income guideline.‖
Responding investors broadly expected to spend approximately 20 years in retirement. However, actuarial survival probabilities for a married couple with average health suggest a 1 in 3 chance that at least one spouse will spend at least 30 years in retirement.# Accordingly, when considering the expected longevity of retirees in the construction of retirement portfolios, advisors assume a longer horizon than savers, typically a 30–year decumulation period. Given this longer horizon, advisors can educate savers about the potential of living longer, thus providing consideration and tolerance for a higher account-balance loss. Advisors focus on preserving ending account balance and aiming to generating a higher withdrawal rate that can help investors fund their retirement more sustainably.
The majority of survey participants ranked sustainable withdrawals as more important than a higher ending account value or lower maximum drawdown. Most respondents also strongly preferred to protect their account value and rely on natural return-seeking income via dividends and interest in retirement. Approximately 57% said they intend to adhere to the sustainable approach to preserve account balances in down markets, even if doing so was likely to affect the consistency of withdrawals over the long term. Despite this preference, sources of retirement income varied by demographic cohort, as younger investors were more receptive to funding withdrawals via asset sales.**
Demographic differences in withdrawal strategies
Withdrawal preferences (% of investors)
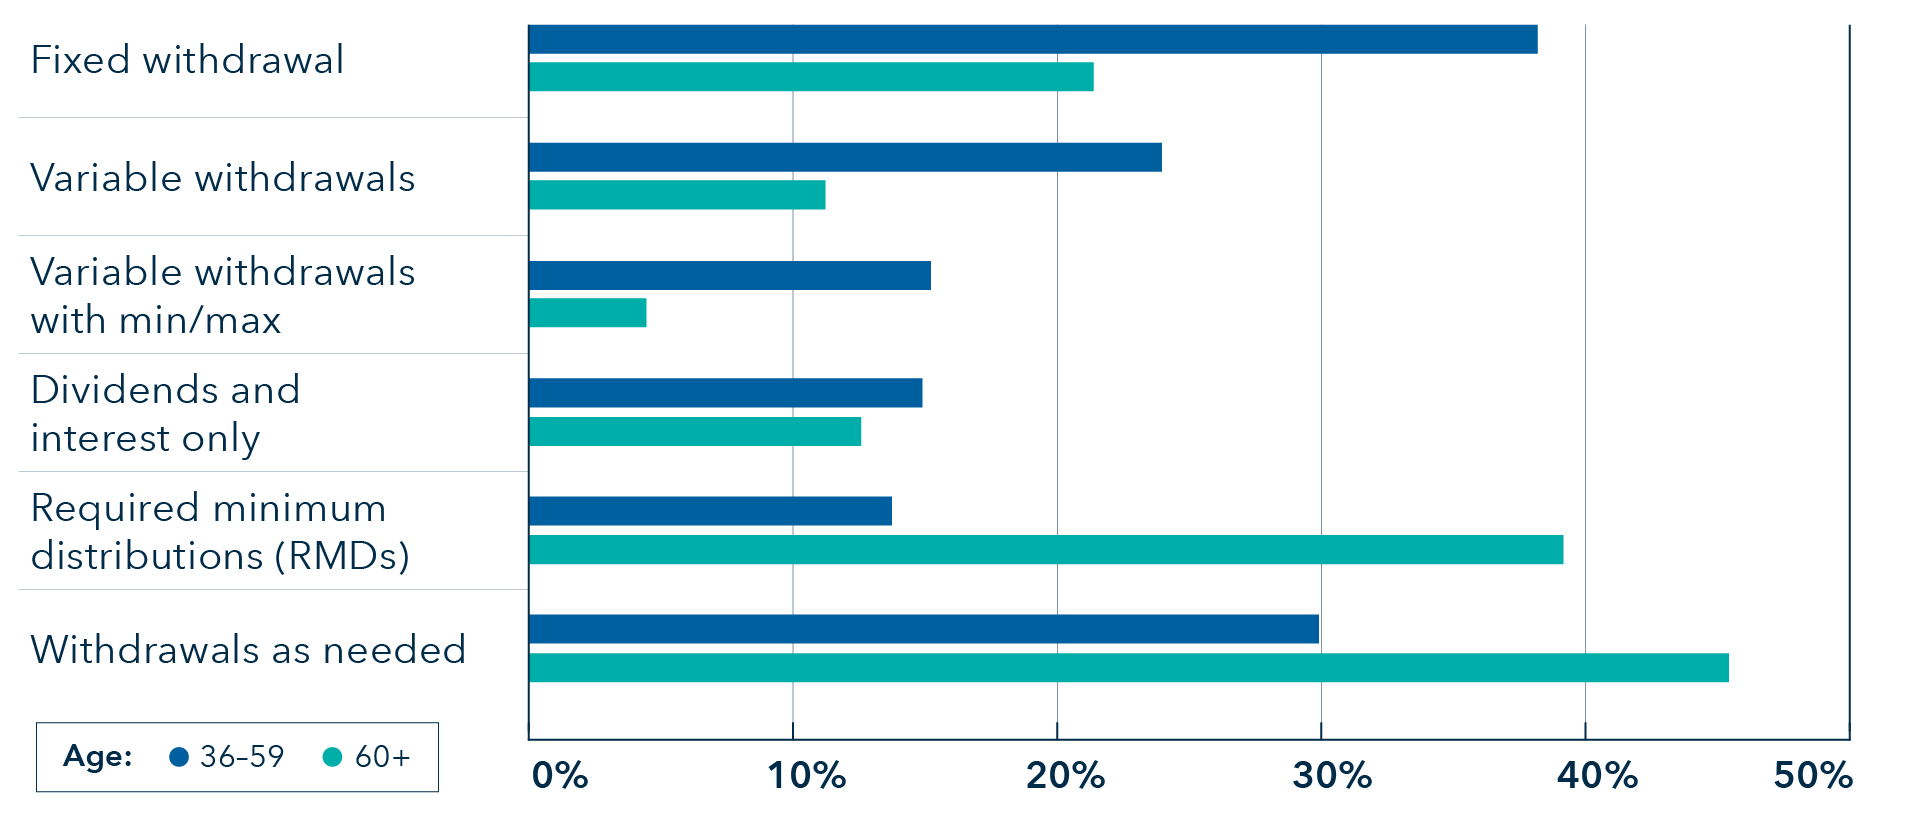
Source: Capital Group. Percentages do not total to 100% due to “select all” options. Refer to Appendix for withdrawal approaches among retired clients.
As shown in the chart above, fixed withdrawals tended to be more popular among younger respondents and investors before retirement, with higher expectations on the role of retirement savings such as 401(k)s and IRAs as their source of retirement income.†† Perhaps considering the lower prevalence of defined benefit pension plans and lesser confidence in receiving Social Security in their retirement age, the preference for fixed withdrawals in younger respondents aligns with their meaningfully higher tolerance for the sale of appreciated assets.
On the other hand, retirees favored an approach of making withdrawals as needed or taking only required minimum distributions. The survey also suggests that since 2015, retirees have become more conservative, giving up higher annual withdrawals to preserve their account balances and moving toward a lower tolerance for experiencing balance loss.
While ending account value, years of withdrawal, and tolerance for balance loss are not the only factors retirees need to contemplate, our findings suggest there is a gap between conventional wisdom and theoretical best practices, as investor preferences tend to assume a shorter retirement. The possibility of retiring earlier than expected and actuarial studies suggesting a longer lifespan mean many investors will be in retirement longer than they expect.
Fielding our analysis on feature preferences, investors strongly preferred maintaining an ending account balance and, in an optimal portfolio, would accept a conventionally lower withdrawal rate and lower tolerance on balance loss for the sake of preservation. Meanwhile, advisor preferences tolerate a higher balance loss and a focus on higher sustainable withdrawal rates due to planning for longer retirement periods.
For advisors and plan sponsors, further research into retirement income trends can enable a better understanding of how best to select and encourage use of multi-asset solutions for investors and participants nearing and entering retirement. For investors and participants, additional guidance in retirement income topics can be provided with the benefit of financial advice, investor education and other methods in the hopes of enabling the achievement of better retirement outcomes.
*Survey methodology
The survey was conducted over the month of November 2021. Results were received from Escalent (the survey partner firm) in February 2022. Capital Group was not identified as the sponsor of the survey.
A total of 2,361 respondents participated in the survey. The mix of respondents had to meet the following criteria to qualify for the survey:
· Age 20 or older
· A mix of retiree/pre-retiree status among age 50+
· Have primary or shared financial decision-making power in the household
· Actively investing
· Mix of advised and unadvised
· Recruit mix based on investible assets
Capital Group investors DCM simulator (feature preferences)
Of the 2,361 respondents who participated in the survey, 1,212 qualify for the discrete choice modeling (DCM). To qualify for the DCM, investors must be retired or 61 or more years old. Both investors and advisors were given sets of choices with varying end account values, max drawdown and investment horizons. Each combination of three parameters was paired with a "realistic" withdrawal rate.
Features and levels
Ending account balance
1. 25%
2. 50%
3. 75%
4. 100%
Years of withdrawal
1. 10 years
2. 20 years
3. 30 years
Tolerance for account balance loss
1. 15% or a decline from $30 to $25.50/share
2. 20% or a decline from $30 to $24.00/share
3. 25% or a decline from $30 to $22.50/share
4. 30% or a decline from $30 to $21.00/share
5. 35% or a decline from $30 to $19.50/share
**Preferred sources of withdrawals
Would you rather have the majority of your withdrawals come from the dividends and interest earned on your account(s) or from the sale of assets within your account(s)?
1. Capital gains (sale of assets)
2. Dividends and interest
3. No preference
Withdrawal approaches among retired clients
Ask if retired: Which of the following withdrawal approaches from your retirement account do you use? (Select all that apply.)
Ask if not retired: Which of the following withdrawal approaches from your retirement account would you use once you reach retirement? (Select all that apply.)
1. Fixed withdrawal — as a percentage of initial account value, growing with inflation over time
2. Variable withdrawals — as a percentage of the current account value, which can change over time
3. Variable withdrawals with min/max — as a percentage of the current account value, which can change over time, but with a minimum or maximum dollar amount for each withdrawal
4. Dividends and interest only — using dividends and interest but not taking anything from the original account value
5. Required minimum distributions — will only withdraw the minimum required amount
6. Withdrawals as needed — will only withdraw funds as needed for expenses
††Expectations on the role of retirement
Ask if not retired: Which of the following resources or sources of income do you expect to use during retirement? (Select all that apply.)
Ask if retired: Which of the following resources or sources of income have you used during retirement? (Select all that apply.)
Randomized answers
1. Social Security
2. Distributions from retirement savings (401(k), IRA, 403(b), etc.)
3. Long-term care insurance
4. Distributions from nonretirement savings (interest bearing bank accounts, individual stocks/bonds in nonretirement accounts, etc.)
5. Employer- or government-sponsored pensions
6. Insurance or annuity payments
7. Income from business or real estate
8. Employer stock
9. Other resources or sources of income; describe here
N/A exclusive: None come to mind
† Social Security Administration. “Starting your retirement benefits early,” SSA.gov. Accessed May 2023.
‡ Social Security Administration. “Normal Retirement Age,” SSA.gov. Accessed May 2023.
§ Jones, Jeffrey M. “More in U.S. Retiring, or Planning to Retire, Later,” Gallup Poll Social Series, July 22, 2022.
‖ Bengen, William P. “Determining Withdrawal Rates Using Historical Data,” Journal of Financial Planning, October 1994.
# American Academy of Actuaries and Society of Actuaries, Actuaries Longevity Illustrator, http://www.longevityillustrator.org
Accessed May 2023.
Our latest insights
-
-
-
Interest Rates
-
Municipal Bonds
-
Artificial Intelligence
RELATED INSIGHTS
Don’t miss out
Get the Capital Ideas newsletter in your inbox every other week