Investment Fund

Share Class
Purchase Restrictions: Class F-3 shares are available through certain registered investment advisor and fee-based programs, but are not available for purchase in most employer-sponsored retirement plans. See the prospectus for details.

Summary

Internal Prompt
A flexible approach to global growth. Seeks to take advantage of evolving global trade patterns by predominantly investing in multinational companies that have strong growth prospects.
Price at NAV $58.69 as of 4/15/2024 (updated daily)
Fund Assets (millions) $132,706.6
Portfolio Managers
10
Expense Ratio
(Gross/Net %)
0.42 / 0.42%

Internal Prompt

Returns at NAV

Returns with Sales Charge

Asset Mix

U.S. Equities51.2%
Non-U.S. Equities44.2%
U.S. Bonds0.0%
Non-U.S. Bonds0.0%
Cash & Equivalents
4.6%
As of 3/31/2024 (updated monthly)

Growth of 10K

Read important investment disclosures
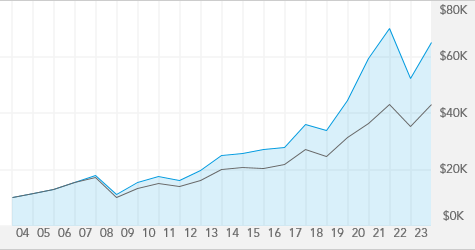
For Class F-3 Shares, this chart tracks a hypothetical investment with dividends reinvested, over the last 20 years, or since inception date if the fund has been in existence under 20 years, through 12/31/2023.
FNPFX
MSCI All Country World Index (ACWI)

High & Low Prices

Market Capitalization

86.8%
Large
12.6%
Medium
0.7%
Small
$136,126.95 Million
Weighted Average


As of 12/31/2023 (updated quarterly). Morningstar data as of 12/31/2023 (updated quarterly).

Morningstar Ownership ZoneTM

Global Large-Stock Growth
Weighted average of holdings
75% of fund's stock holdings
Morningstar data as of 12/31/23 (updated quarterly)

Description

Fund Objective
The fund's investment objective is to provide you with long-term growth of capital.
Distinguishing Characteristics
Seeks to take advantage of evolving global trade patterns by predominantly investing in companies that have potential for growth in capital. Invests primarily in multinational companies with a meaningful share of their sales and operations outside of their home countries. This approach provides the strategy’s portfolio managers with geographic flexibility and the ability to navigate different markets.
Types of Investments
Invests primarily in common stocks that are believed to have the potential for growth.
Holdings Outside the U.S.
The fund may invest up to 100% of assets outside the United States, though this is unlikely since New Perspective Fund is a global fund.

Fund Facts

Fund Inception 3/13/1973
Fund Assets (millions)
As of 2/29/2024
$132,706.6
Companies/Issuers
Holdings are as of 3/31/2024 (updated monthly).
266+
Shareholder Accounts
Shareholder accounts are as of 3/31/2024
628,381
Regular Dividends Paid
Dec
Minimum Initial Investment $250
Capital Gains Paid
Dec
Portfolio Turnover (2023) 17%
Fiscal Year-End Sep
Prospectus Date 12/01/2023
CUSIP 648018 77 8
Fund Number 707

Returns

Internal Prompt

Month-End Returns as of 3/31/24

Quarter-End Returns as of 3/31/24

Internal Prompt

Volatility & Return

Read important investment disclosures

Equities

For Class F-3 Shares, this chart tracks the 10-year standard deviation
and 10-year annualized return of the equity funds
FNPFX
MSCI All Country World Index (ACWI)
Other AF Funds
Standard Deviation as of 03/31/2024 (updated monthly) . Annualized return as of 03/31/2024 (updated monthly) .
VIEW LARGER CHART
Internal Prompt

Yield

12-month
Distribution Rates
30-day SEC Yield
Fund at NAV 1.11% 1.19%
Fund at MOP N/A N/A
As of 3/31/2024 (updated monthly)

Valuation

Price/ Price/ Price/
Book Cash Flow Earnings
Fund 3.33 13.00 18.82
MSCI All Country World Index (ACWI)
2.50 10.90 16.60
Fund as of 12/31/23. Index as of 12/31/23.

Portfolio Management

Years of Experience with Fund
Years of Experience with Capital Group
Years of Experience with Investment Industry
Barbara Burtin 5 15
Noriko Honda Chen 11 25 34
Patrice Collette 5 24 29
Brady L. Enright 18 27 35
Kohei Higashi 3 20 27
Jody Jonsson 18 33 39
Robert W. Lovelace 23 38
Anne-Marie Peterson 3 19 29
Andraz Razen 8 19 25
Steven T. Watson 18 34 36
A boldface number indicates that years of experience with Capital Group is equal to years of experience with investment industry.

Ratings & Risk

Morningstar Rating TM


Overall Morningstar RatingTM
Funds rated(322)
3-yr. Morningstar RatingTM
(322 funds rated)
5-yr. Morningstar RatingTM
(279 funds rated)
10-yr. Morningstar RatingTM
(188 funds rated)
Overall Morningstar Risk Average
HIGH
LOW
Category Global Large-Stock Growth
Ratings are based on risk-adjusted returns as of 3/31/2024 (updated monthly).

Risk Measures

Fund
Standard Deviation
15.84
Sharpe Ratio
0.64
For the 10 Years ending 3/31/24 (updated monthly).
American Funds/
Morningstar Benchmark
MSCI ACWI NR USD
R-squared 95
Beta 1.05
Capture Ratio (Downside/Upside) 100/108
American Funds and Morningstar Benchmark for the 10 Years ending 3/31/24 (updated monthly).
Active Share
65.3%
As of 12/31/23 (updated quarterly)

Holdings

Equities Breakdown

Equity Fund Holdings
Information technology 20.8%
Health care 14.8%
Industrials 14.8%
Consumer discretionary 11.7%
Financials 10.4%
Communication services 9.0%
Consumer staples 5.4%
Materials 4.5%
Energy 3.0%
Utilities 0.6%
Real estate 0.4%

% of net assets as of 3/31/2024 (updated monthly)

Top Equities

Microsoft
3.9%
Meta Platforms
3.3%
Novo Nordisk
3.0%
TSMC
2.5%
Broadcom
2.4%
Alphabet
1.8%
ASML
1.8%
AstraZeneca
1.6%
Eli Lilly
1.6%
NVIDIA
1.5%

% of net assets as of 3/31/2024 (updated monthly)

Geographic Breakdown

United States
51.2%
Europe
29.1%
Asia & Pacific Basin
10.9%
Other (Including Canada & Latin America)
4.3%
Cash & equivalents
4.6%
% of net assets as of 3/31/2024 (updated monthly)

The New Geography of Investing ®

Regions Fund
MSCI All Country World Index (ACWI)
United States 53.7% 63.8%
Canada 3.2% 2.8%
Europe 30.6% 15.5%
Japan 4.0% 5.5%
Asia-Pacific ex. Japan 2.0% 2.5%
Emerging Markets 6.5% 10.0%

% of net assets as of 3/31/2024 (updated monthly)

Fund Breakdown by Domicile

Regions Fund
MSCI All Country World Index (ACWI)
United States 51.2% 63.8%
Canada 3.0% 2.8%
Europe 29.2% 15.5%
Japan 3.9% 5.5%
Asia-Pacific ex. Japan 1.9% 2.5%
Emerging Markets 6.2% 10.0%
Cash & Equivalents
4.6% 0.0%

% of net assets as of 3/31/2024 (updated monthly)

Prices & Distributions

Internal Prompt

Historical Prices Month-End

Historical Prices Year-End

Internal Prompt

Historical Distributions as of 01/25/24

2023
Record
Date
Calculated
Date
Pay Date
Income Dividend Regular
Income Dividend Special
Cap. Gains Long-Term
Cap. Gains Short-Term
Reinvest NAV
12/14/23 12/14/23 12/15/23 $0.701 $0.00 $2.4715 $0.00 $54.99
2023 Year-to-Date: Dividends Subtotal: $0.701 Cap Gains Subtotal: $2.4715
Total Distributions: $3.1725

Fees & Expenses

Internal Prompt

Fees

Annual Management Fees 0.37%
Other Expenses 0.05%
Service 12b-1 --
As of each fund's most recent prospectus.
Internal Prompt

Expense Ratio

FNPFX 0.42%
Lipper Global Funds Average
0.85%
Fund as of most recent prospectus. Lipper Category as of 3/31/24 (updated quarterly).

Resources