Investment Fund

Share Class

Summary

Internal Prompt
Built for long-term growth. Seeks to help investors pursue longer term goals through exposure to a diverse mix of stocks of companies with strong growth potential.
Price at NAV $23.41 as of 4/18/2024 (updated daily)
Fund Assets (millions) $17,738.5
Portfolio Solutions Committee Members
7
Expense Ratio
(Gross/Net %)
0.75 / 0.75%

Underlying Funds

Asset Mix

U.S. Equities75.3%
Non-U.S. Equities21.0%
U.S. Bonds0.0%
Non-U.S. Bonds0.0%
Cash & Equivalents
3.6%
As of 3/31/2024 (updated monthly)

Market Capitalization

66.2%
Large
24.9%
Medium
8.9%
Small
$91,078.86 Million
Weighted Average


As of 12/31/2023 (updated quarterly). Morningstar data as of 3/31/2024 (updated quarterly).
Internal Prompt

Volatility & Return

Read important investment disclosures

Equities

For Class A Shares, this chart tracks the 10-year standard deviation
and 10-year annualized return of the equity funds
GWPAX
S&P 500 Index
Other AF Funds
Standard Deviation as of 03/31/2024 (updated monthly) . Annualized return as of 03/31/2024 (updated monthly) .
VIEW LARGER CHART
Internal Prompt

Returns at NAV

Returns at MOP

Read important investment disclosures
22.54%
1-year return
10.33%
5-year return
9.40%
10-year return
0.54%
30-Day SEC Yield
Returns as of 3/31/24 (updated monthly). Yield as of 3/31/24 (updated monthly).

Morningstar Ownership ZoneTM

Aggressive Allocation
Weighted average of holdings
75% of fund's stock holdings
Morningstar data as of 3/31/24 (updated quarterly)

Description

Objective
The fund's investment objective is to provide long-term growth of capital.
Distinguishing Characteristics
Pursues its investment objectives by investing in a mix of American Funds in different combinations and weightings.
Types of Investments
The underlying American Funds will primarily consist of growth funds and growth-and-income funds, which principally invest in equity securities domiciled in the United States but may also have significant holdings of issuers domiciled outside the United States.

Fund Facts

Fund Inception 5/18/2012
Fund Assets (millions)
As of 2/29/2024
$17,738.5
Companies/Issuers
Holdings are as of 3/31/2024 (updated monthly).
1268+
Shareholder Accounts
Shareholder accounts are as of 3/31/2024
436,108
Regular Dividends Paid
Dec
Minimum Initial Investment $250
Capital Gains Paid
Dec
Portfolio Turnover (2023) 1%
Fiscal Year-End Oct
Prospectus Date 01/01/2024
CUSIP 02630R 78 1
Fund Number 53

Returns

Internal Prompt

Month-End Returns as of 3/31/24

Quarter-End Returns as of 3/31/24

Growth of 10K

Read important investment disclosures
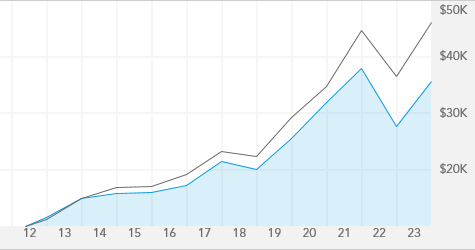
For Class A Shares, this chart tracks a hypothetical investment with dividends reinvested, over the last 20 years, or since inception date if the fund has been in existence under 20 years, through 12/31/2023.
GWPAX
S&P 500 Index

High & Low Prices

Internal Prompt

Yield

12-month
Distribution Rates
30-day SEC Yield
Fund at NAV 0.63% N/A
Fund at MOP 0.59% 0.54%
As of 3/31/2024 (updated monthly)

Valuation

Price/ Price/ Price/
Book Cash Flow Earnings
Fund 4.02 14.28 22.88
S&P 500 Index
3.80 13.90 19.90
Fund as of 3/31/24. Index as of 12/31/23.

Portfolio Solutions Committee

Years of Experience with Fund
Years of Experience with Capital Group
Years of Experience with Investment Industry
Alan N. Berro 12 33 38
Michelle J. Black 4 22 29
Brittain Ezzes 1 2 26
Samir Mathur 4 11 31
Wesley K. Phoa 12 25 30
John R. Queen 4 22 34
Andrew B. Suzman 12 30
A boldface number indicates that years of experience with Capital Group is equal to years of experience with investment industry.

Ratings & Risk

Morningstar Rating TM


Overall Morningstar RatingTM
Funds rated(177)
3-yr. Morningstar RatingTM
(177 funds rated)
5-yr. Morningstar RatingTM
(163 funds rated)
10-yr. Morningstar RatingTM
(129 funds rated)
Overall Morningstar Risk Above Average
HIGH
LOW
Category Aggressive Allocation
Ratings are based on risk-adjusted returns as of 3/31/2024 (updated monthly).
Internal Prompt

Lipper Leader Scorecard

Over-all 3 yr. 5 yr. 10 yr.
Consistent Return Within Category
Funds Rated

(150)

(150)

(116)

(68)
Expense Within Category
Funds Rated

(36)

(36)

(28)

(18)
Preservation Within Category
Funds Rated

(12478)

(12478)

(11421)

(8277)
Tax Efficiency Within Category
Funds Rated

(150)

(150)

(116)

(68)
Total Return Within Category
Funds Rated

(150)

(150)

(116)

(68)
Category Global Multi-Cap Growth
KEY
HIGHEST LOWEST
As of 3/31/2024 (updated monthly)

Risk Measures

Fund
Standard Deviation
15.52
Sharpe Ratio
0.60
For the 10 Years ending 3/31/24 (updated monthly).
American Funds
Benchmark
Morningstar
Benchmark
S&P 500 Index
Morningstar Mod Tgt Risk TR USD
R-squared 94 92
Beta 0.99 1.50
Capture Ratio (Downside/Upside) 107/94 149/157
American Funds Benchmark for the 10 Years ending 3/31/24 (updated monthly).
Morningstar Benchmark for the 10 Years ending 3/31/24 (updated monthly).

Holdings

Equities Breakdown

Equity Fund Holdings
Information technology 24.6%
Industrials 14.8%
Consumer discretionary 13.9%
Health care 13.8%
Financials 10.2%
Communication services 8.3%
Consumer staples 3.9%
Materials 2.7%
Energy 2.7%
Utilities 0.8%
Real estate 0.7%

% of net assets as of 3/31/2024 (updated monthly)

Geographic Breakdown

United States
75.3%
Europe
11.1%
Asia & Pacific Basin
6.4%
Other (Including Canada & Latin America)
3.5%
Cash & equivalents
3.6%
% of net assets as of 3/31/2024 (updated monthly)

Prices & Distributions

Internal Prompt

Historical Prices Month-End

Historical Prices Year-End

Internal Prompt

Historical Distributions as of 01/25/24

2023
Record
Date
Calculated
Date
Pay Date
Income Dividend Regular
Income Dividend Special
Cap. Gains Long-Term
Cap. Gains Short-Term
Reinvest NAV
12/27/23 12/27/23 12/28/23 $0.1556 $0.00 $0.2043 $0.00 $22.45
2023 Year-to-Date: Dividends Subtotal: $0.1556 Cap Gains Subtotal: $0.2043
Total Distributions: $0.3599

Fees & Expenses

Internal Prompt

Fees

Annual Management Fees 0.00%
Other Expenses 0.13%
Acquired (Underlying) Fund Fees and Expenses 0.38%
Service 12b-1 0.24%
As of each fund's most recent prospectus.
Internal Prompt

Expense Ratio

GWPAX 0.75%
Lipper Global Multi-Cap Growth Funds Average
0.78%
Fund as of most recent prospectus. Lipper Category as of 3/31/24 (updated quarterly).