Japan
 Anne Vandenabeele
 Eu-Gene Cheah
 Steve Caruthers
All of a sudden, it's like 1989 in Japan. The MSCI Japan Index has once again climbed to its lofty highs when Japanese companies dominated the business world. Many have asked if this current boom is sustainable, especially after three decades of deflation and disappointing equity returns in the wake of the country's asset price bubble.
We think this time is different. The Bank of Japan scrapped the negative interest rate policy it launched in 2016 and raised rates for the first time in 17 years. Also, impediments to equity returns, present since the 1990s, appear to be receding and could result in Japan's equity market rerating to higher valuations.
Foremost among these is an end to Japan's long spell of deflation. Inflation has held at or above 2% since April 2022. Productivity growth is poised to rise, which along with sustained inflation, could boost corporate earnings growth. Meanwhile, the ongoing push by regulators to improve corporate governance and encourage consolidation through mergers and acquisitions could raise profitability at many companies, which would allow for better capital allocation and help boost dividends. Furthermore, a shrinking population is causing chronic labor shortages, forcing companies to seek efficiencies.
The sun rises again: Japanese stocks surge to 1989 levels
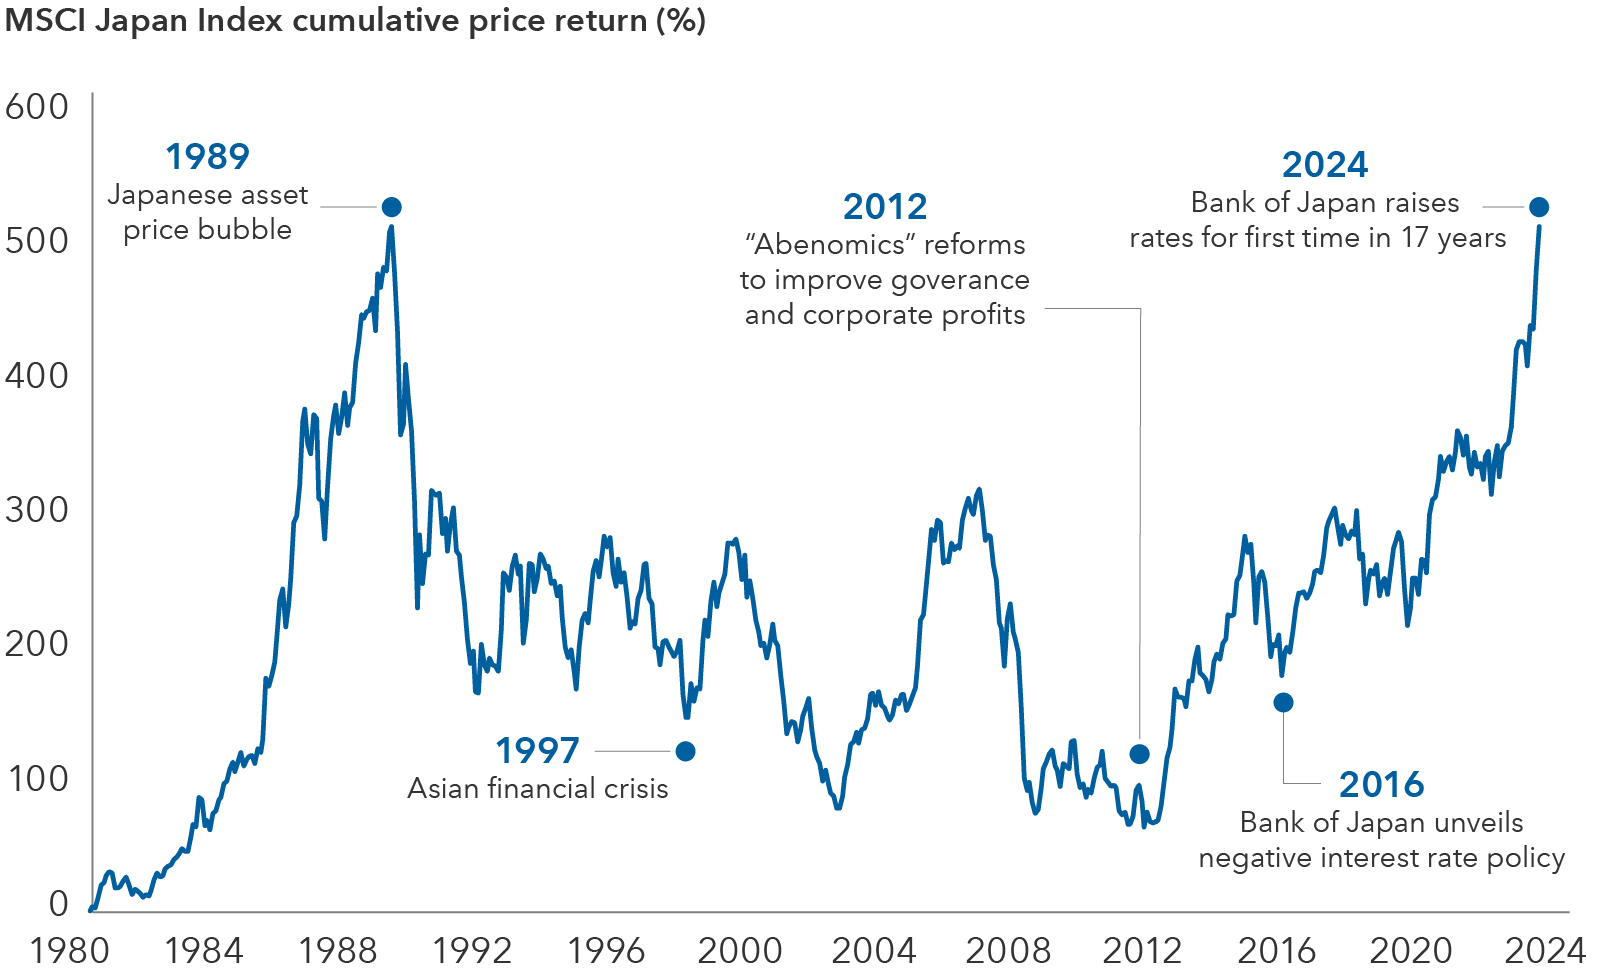
Sources: Capital Group, MSCI, RIMES. Cumulative price returns shown from December 31, 1980, to February 29, 2024. Returns shown in Japanese yen. The cumulative return is the total change in the investment price over a set time. Past results are not predictive of results in future periods.
Inflation and rising rates could lift long-suppressed valuations
Despite the rally in Japanese stocks, valuations appear reasonable at 16 times forward earnings for the next 12 months (as of March 19, 2024). The market's forward price-to-earnings (P/E) has been range-bound for many years, held down by prolonged deflation and low interest rates, as well as subpar capital allocation and corporate governance.
In a deflationary economy, the traditional discount rate relationship between interest rates and P/E ratios seems to invert. This dynamic has most likely inhibited market valuations from rising much above 17 times earnings during the past 10 years. Longer term, it’s plausible to imagine interest rates rising to 2%, thanks to higher productivity growth and inflation, which would open the possibility of the market P/E rising to 20–25 times over time.
Valuations for Japanese equities have been range-bound
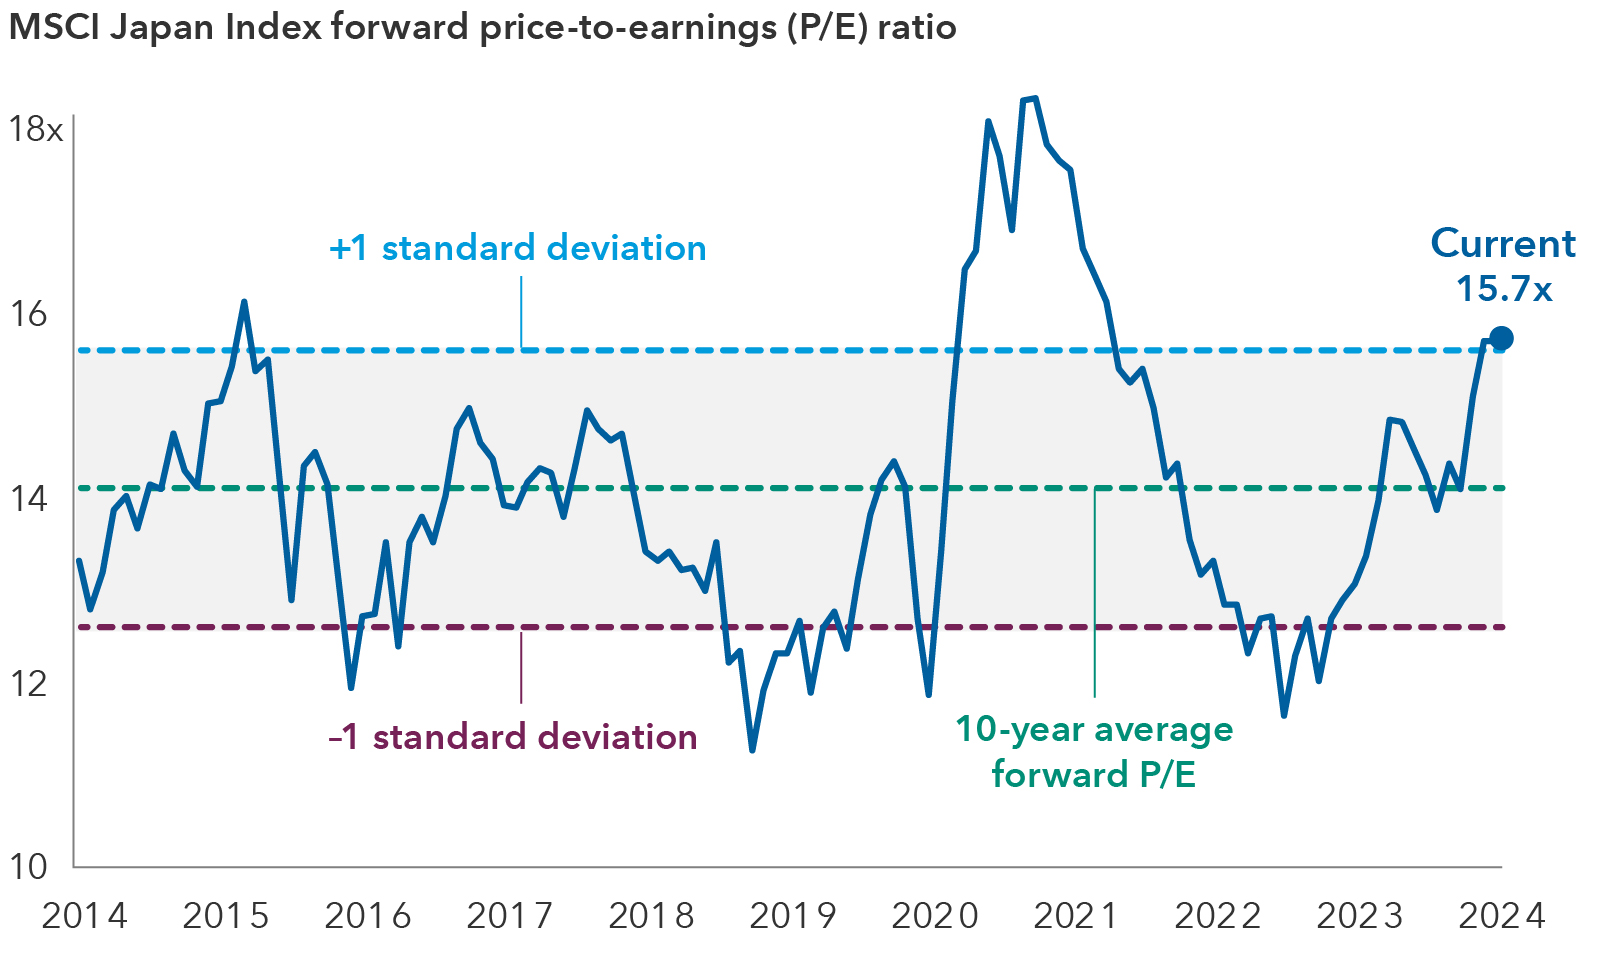
Source: FactSet. Data as of March 19, 2024.
What could drive domestic productivity and earnings growth?
1. Digital overhaul: A digital transformation (including AI) is happening across the economy from payment systems to back-office operations. Banks like Resona, for example, plan to automate 10,000 jobs. Japan's digital revamp can provide solutions to labor shortages and free workers to move to higher value-added jobs.
2. Erosion of lifetime employment: More top graduates are opting out of traditional employment, choosing to work in consulting, at startups or launching their own businesses. Younger workers are also changing jobs after three years. A younger generation is showing greater entrepreneurship and is looking for opportunities in new economy companies rather than the old guard companies.
3. Service sector consolidation: The median age of small- and medium-sized business owners is 67. A large fraction of these firms could shutter or be bought by more profitable companies over the next five to 10 years. This could boost productivity, especially in the service sector which traditionally has been half as productive as manufacturing.
4. Corporate efficiency: The five-year average for returns on equity (ROE) for TOPIX 500 Index companies was 8% as of December 31, 2023. That's a stark contrast to 12% in Europe (STOXX 600 Index) and 17% in the U.S. (S&P 500 Index). The broad push by Japanese regulators and foreign hedge funds to increase ROE across Japan's corporate sector could raise earnings growth materially.
A more attractive place to invest
Japanese firms have developed unique technologies in niche markets, building durable businesses with highly defensible moats. They are also positioned to capitalize on global supply chain shifts amid heightened geopolitical tensions as companies and countries seek multiple sources for supplies.
For instance, a powerhouse in semiconductor manufacturing in the 1980s and '90s, Japan is seeing renewed interest from multinational companies in the industry. TSMC, Micron Technology, and Samsung Electronics are building new chipmaking plants in the country given Japan's skilled and specialized talent pool. These investments could be a tailwind for Japanese firms such as SMC, a specialized components maker for semiconductor production; Shin-Etsu, the world’s largest maker of silicon wafers; and Tokyo Electron, the country's largest chip-equipment manufacturer.
Elsewhere, Japanese information technology (IT) service companies will likely continue to be beneficiaries of increased spending. Japan is playing catch-up moving into the digital age. There is a shortage of engineers, and an aging workforce means employee productivity needs to improve. Rising demand is empowering IT service providers to obtain more favorable pricing terms that should help profit margins.
While long reluctant to do so, Japanese companies have also been raising prices, ranging from Disneyland operator Oriental Land to snacks maker Kotobuki Spirits to heavy equipment manufacturer Komatsu. This could support margins.
Other companies are reinventing themselves, presenting attractive investment opportunities. For example, pharmaceuticals firm Daiichi-Sankyo, once hampered by a portfolio of undifferentiated drugs, has a promising pipeline of novel cancer treatments.
The country's small- to mid-cap sector is another hunting ground. The small-cap market is less covered by sell-side brokerage houses, giving active investors the option to invest in less known — or misunderstood — companies.
Collectively, many of these positive developments are making Japan a more attractive place to invest. At its peak in the late 1980s, Japan represented more than 40% of the MSCI World Index. Today, it accounts for 6%. Its role in global equities should expand amid increasing interest from investors.
The MSCI Japan Index is designed to measure the performance of the large- and mid-cap segments of the Japanese market.
S&P 500 Index is a market-capitalization-weighted index based on the results of 500 widely held common stocks.
The STOXX 600 Index represents large-, mid- and small-capitalization companies across 17 countries of the European region: Austria, Belgium, Denmark, Finland, France, Germany, Ireland, Italy, Luxembourg, the Netherlands, Norway, Poland, Portugal, Spain, Sweden, Switzerland and the United Kingdom.
TOPIX 500 Index is a market capitalization-weighted index consisting of the 500 largest and most liquid components of the Tokyo Stock Price Index (TOPIX).
The market indexes are unmanaged and, therefore, have no expenses. Investors may not invest directly in an index.
MSCI has not approved, reviewed or produced this report, makes no express or implied warranties or representations and is not liable whatsoever for any data in the report. You may not redistribute the MSCI data or use it as a basis for other indices or investment products.
The S&P 500 (“Index”) is a product of S&P Dow Jones Indices LLC and/or its affiliates and has been licensed for use by Capital Group. Copyright © 2024 S&P Dow Jones Indices LLC, a division of S&P Global, and/or its affiliates. All rights reserved. Redistribution or reproduction in whole or in part is prohibited without written permission of S&P Dow Jones Indices LLC.
Forward price-to-earnings ratio reflects the current share price relative to the consensus estimate for earnings per share on a 12-month forward basis.
Our latest insights
-
-
Interest Rates
-
-
Municipal Bonds
-
Artificial Intelligence
RELATED INSIGHTS
-
U.S. Equities
-
-
Technology & Innovation
Never miss an insight
The Capital Ideas newsletter delivers weekly investment insights straight to your inbox.