Interest Rates
Categories
Investing Strategy
Midyear Outlook: Navigating the great realignment
The world has changed significantly in the six months since Capital Group released its initial 2022 Outlook. Perhaps the single-biggest theme at this time is the idea of a reset or realignment. “We are living through a pivotal time in history, marked by geopolitical realignment, high inflation, volatile financial markets and the end of a 40-year period of declining interest rates,” notes Rob Lovelace, vice chair and president of Capital Group.
In some ways the current environment resembles the 1960s, when interest rates bottomed out after a long decline and the Cold War intensified. Today’s investment landscape may seem daunting, but there are several reasons for optimism. A realignment could reset the investing table for future, healthy growth.
KEY TAKEAWAYS
- In today’s volatile and dynamic investment environment, it can be valuable to be selective, focus on fundamentals and build all-weather portfolios focused on resilient investment opportunities.
- Equity markets have historically performed well during rising rate environments, and strong dividend yields can bolster returns when inflation is elevated.
- After a rough recent period for fixed income investors, indications are that most of the pain may already be priced in and the outlook for fixed income is positive as income is now back in the picture.
The world has changed significantly in the six months since Capital Group released its initial 2022 Outlook. Perhaps the single-biggest theme at this time is the idea of a reset or realignment. “We are living through a pivotal time in history, marked by geopolitical realignment, high inflation, volatile financial markets and the end of a 40-year period of declining interest rates,” notes Rob Lovelace, vice chair and president of Capital Group.
In some ways the current environment resembles the 1960s, when interest rates bottomed out after a long decline and the Cold War intensified. Today’s investment landscape may seem daunting, but there are several reasons for optimism. A realignment could reset the investing table for future, healthy growth. The global economy is still expanding as it emerges from the pandemic with pent-up energy. Equity prices have faltered, but corporate earnings — not multiple expansion — should drive valuations going forward. This would mean a welcome return to fundamentals. And although it may be widely feared, a mild to moderate U.S. recession could be positive if it helps tame inflation and drive out past excesses.
While this healthy reset takes place, the emphasis should be on maintaining a balanced, resilient portfolio that can withstand varying market conditions. “The environment is changing rapidly, and significant headwinds have emerged. This is a good time to pursue all-weather portfolios built to withstand a variety of risks,” says Jared Franz, U.S. and Latin America economist at Capital Group.
Equity outlook
Investors should expect financial market volatility to remain heightened as the U.S. Federal Reserve seeks to fight inflation with higher interest rates and quantitative tightening. Historically, the Fed has tended to back off when rising rates threatened to stifle the economy. This time, they have less room to maneuver, and it may not be possible to bring down inflation without pushing the global economy into recession. “We are seeing a significant deviation from the standard Fed playbook,” says Tim Ng, a fixed income portfolio manager at Capital Group. “And the reason is clear: Inflation is far too high.”
The good news is that equity markets have historically weathered rising rate periods very well. In the eight rate-hiking periods since 1977, the S&P 500 Index posted an average annualized return of 12.7%.
Equities have ridden out rate hikes
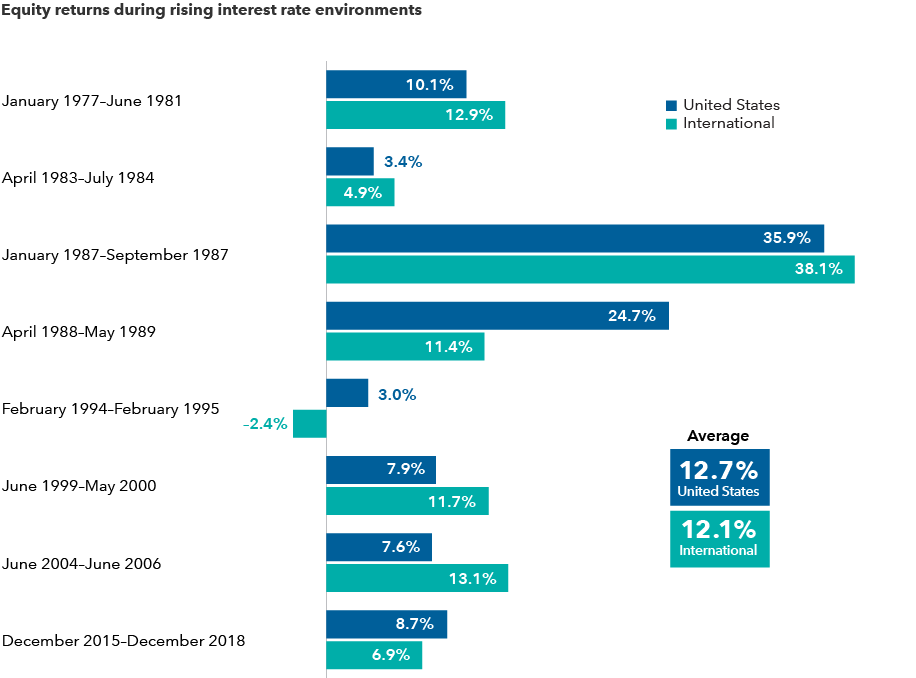
Sources: Capital Group, MSCI, Refinitiv Datastream, Standard & Poor’s, U.S. Federal Reserve. S&P 500 and MSCI World returns represent annualized total returns for U.S. and international stocks, respectively. S&P 500 is a market capitalization-weighted index based on the results of approximately 500 widely held common stocks. MSCI World Index is a free float-adjusted market capitalization-weighted index designed to measure equity market results of developed markets. The indexes are unmanaged and, therefore, have no expenses. Investors cannot invest directly in an index.
Given a volatile market and interest rate uncertainty, caution is warranted. In this sort of environment, it can be valuable to be selective and emphasize fundamentals. Investors may want to focus on all-weather portfolios that concentrate on attractively valued companies with a history of thriving amid challenging economic environments.
“I generally don’t pay too much attention to macro, unless we’re at inflection points where I think it really matters. Now feels like one of those points,” says Diana Wagner, an equity portfolio manager at Capital Group. “In a world where growth may be scarce, I prefer companies that have a demonstrated track record of making their own growth happen — companies with a high return on equity, low commodity input costs and strong pricing power.”
The return of dividends
Rising multiples have driven equity valuations over the past decade, so many investors may have forgotten that total return is made up of income — in this case, dividends — as well as capital appreciation. Dividend growth can bolster returns when inflation is rising.
Global companies in the MSCI All Country World Index paid out a remarkable $1.9 trillion in dividends over the 12 months prior to June 30, 2022 — a 20% increase from the previous 12-month period. “In this low-growth, inflationary environment, I am focusing on companies with manageable debt and sustainable dividends,” says Caroline Randall, a portfolio manager at Capital Group. “We are finding many across a range of sectors that are increasing dividends 10% a year.”
Rising dividends signal managements’ confidence in future earnings growth, adds Randall. Dividend growers can be found in a variety of sectors, including financials, energy, materials and health care.
Dividends matter
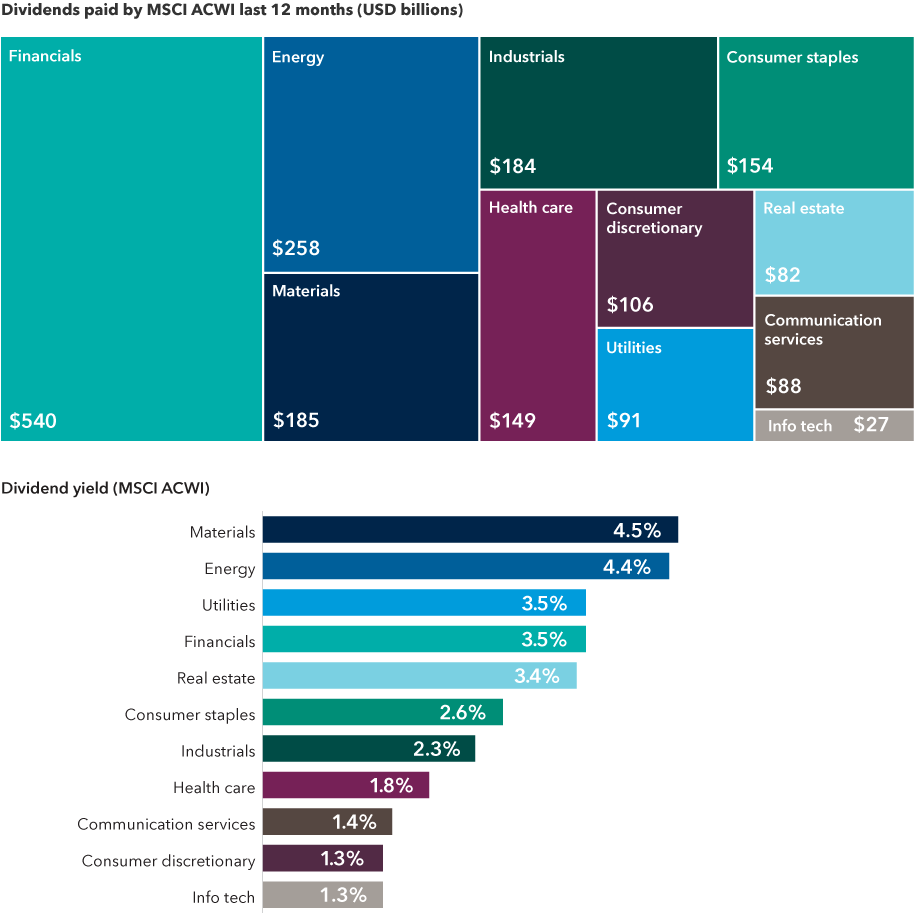
Sources: Capital Group, MSCI, Refinitiv Datastream, Refinitiv Eikon, RIMES. Dividends paid represent total cash dividends in the trailing 12-month period through June 30, 2022. Dividend yield is for MSCI ACWI as of June 30, 2022. MSCI All Country World Index (ACWI) is a free float-adjusted market capitalization-weighted index designed to measure equity market results in the global developed and emerging markets, consisting of more than 40 developed and emerging market country indexes.
Spotlight on four equity sector themes
Technology: The tech sector has been beaten down, but don’t throw out the baby with the bathwater. For well-managed companies in fast-growing sectors, nothing has really changed. Look at cloud services, for instance. We are in the early days of the U.S. industrial base moving its traditional enterprise IT functions to the cloud. The three leaders of this movement — Alphabet, Amazon and Microsoft — are all growing their cloud businesses at astonishing speeds. In 2021, both Microsoft and Amazon saw cloud revenue increase by over 60%. As of April 2022, Microsoft is on target to reach nearly $100 billion in annual cloud revenue. “That is why selective investing through fundamental research is essential,” says Chris Buchbinder, an equity portfolio manager at Capital Group.
Mining: The global mining industry is getting more attention as commodity prices soar. Basic materials like iron ore, copper and nickel play a crucial role in the global economy. This sector looks undervalued — the market capitalization of the world’s five-largest mining companies combined barely exceeds the value of Facebook parent Meta Platforms (data from RIMES as of May 31, 2022). “Investors are starting to embrace companies that produce tangible assets,” says Carl Kawaja, an equity portfolio manager at Capital Group. “For instance, nickel and copper are key components in the production of electric vehicles. People underappreciate the extent to which you still need a lot of nickel and copper to build them.”
Health care: Despite the focus on health care companies during the pandemic, many are undervalued relative to the broader market. A key theme is personalized medicine, as drug developers, device makers and service providers strive to transform health care and improve patient outcomes. “Drug discovery is in a golden age that would not be possible without the combination of efficient genetic sequencing, computational power to analyze massive data sets, and precise biochemical tools,” says Alan Wilson, a portfolio manager at Capital Group. It is critical to be selective, focus on fundamentals and understand both the science and the business opportunity.
Smart industrials: The sustainable revolution goes beyond renewables and electric vehicles. It includes innovative companies in legacy industries that are actively supporting the transition to clean energy. For example, buildings pump more carbon dioxide into the atmosphere than the entire transport industry. Companies like Carrier and Daikin are developing air conditioning and heating systems that could drastically reduce global greenhouse gas emissions. Swiss building materials supplier Sika makes cement additives that can reduce carbon emissions and increase durability; its growth potential is compelling as global emissions standards tighten. The solution to environmental, social and governance (ESG) issues often comes from unexpected places. “We don’t think of ESG as just an exclusion process,” says Lovelace. “We think of it as identifying companies that are doing the right thing and supporting those in transition.”
Fixed income outlook
The first half of 2022 was an extremely challenging time for bonds. As the Fed embarked on its rate-hike program, the Bloomberg U.S. Aggregate Index, the core bond market benchmark, was down over 10% by mid-June, its worst result in 40 years.
But this is far from the whole story. Indications are that most of the pain is already priced in and the outlook for fixed income is quite positive. Bonds have weathered rising rates quite well. During the eight rate-hike periods in the past 50 years, the average annual return on bonds was 2.3% as yields rose to counter capital depreciation. More importantly, this set the stage for recovery — bond returns in the two years following those periods were 13.2% and 12.6%, respectively.
Bond yields are not expected to rise much further. Futures markets indicate that investors expect U.S. Treasury yields in the 2- and 10-year maturity spectrum to rise only 11 to 40 basis points over the next year. Consider a hypothetical example based on the interest rate exposure of the Bloomberg U.S. Aggregate Index; even if rates rose a full 0.4% across the Treasury curve during that period, the increased yield would overshadow the price decline to produce a positive total return.
“I do not expect yields to continue to rise like they have since mid-2021,” says Ritchie Tuazon, a fixed income portfolio manager at Capital Group. “We’re in a late-cycle economy when persistent inflation and other factors could translate to more fierce equity volatility. Now isn’t a time to shy away from maintaining a strong core bond allocation for diversification.”
Interest income is back in focus
Rising yields mean that the “income” portion of fixed income is back in the picture. It is easy to overlook just how much yields have climbed and what that means in terms of additional return on bond portfolios. Since recent lows, yields on high-yield corporates are up by 4.79%, emerging markets (EM) debt is up by 3.35% and both investment-grade (BBB/Baa and above) corporates and 2- and 10-year Treasuries have added about 3%. This sets the stage for further growth. Historically, when bonds have been at recent yield levels, average 5-year forward returns have ranged from about 4% for the aggregate bond index to about 8% for both high-yield corporates and EM debt.
Putting “income” back into fixed income
Yields have climbed substantially from recent lows, making interest income again a material component of bond returns and setting the stage for future growth.
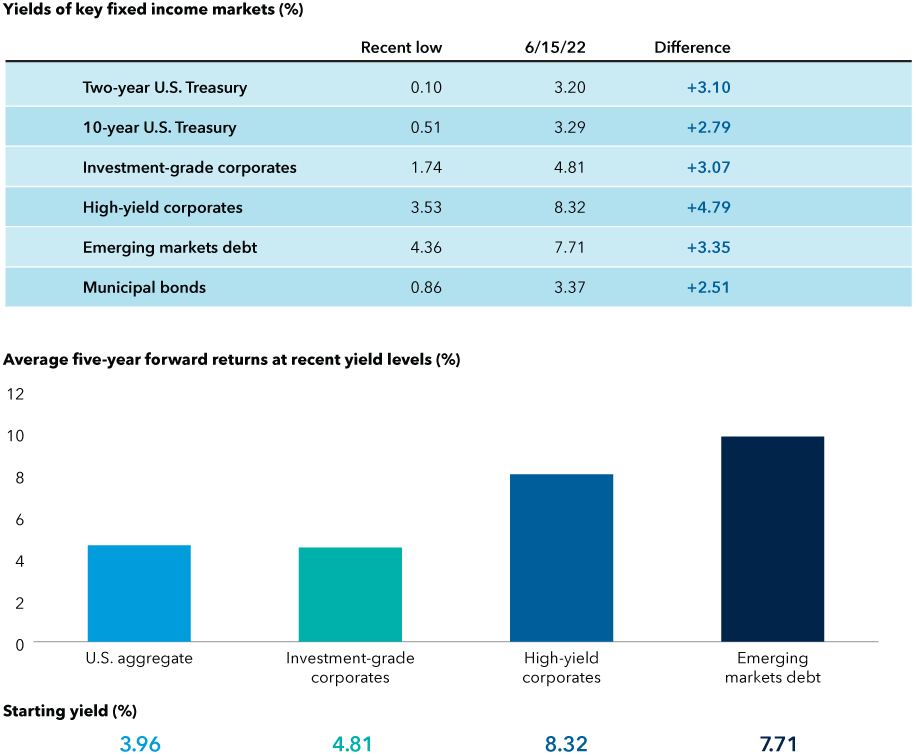
Sources: Capital Group. Bloomberg, JPMorgan, Federal Reserve. Yields as of June 15, 2022. Returns as of May 31, 2022. Sector yields above include Bloomberg U.S. Aggregate Index, Bloomberg U.S. Corporate Investment Grade Index, Bloomberg U.S. Corporate High Yield Index, 50%/50% JP Morgan EMBI Global/JP Morgan GBI-EM Global Diversified blend and Bloomberg Municipal Bond Index. For chart on top: Period of time considered from 2020 to present. Dates for lows from top to bottom in chart shown are: February 5, 2021; August 4, 2020; December 31, 2020; July 6, 2021; January 4, 2021; and July 21, 2021. For the chart below: Return data goes back to 2000 for all sectors except for emerging markets debt, which goes back to 2003. Based on average monthly returns for each sector when in a +/- 0.30% range of yield to worst (yield to worst is the lowest yield that can be realized by either calling or putting on one of the available call/put dates, or holding a bond to maturity).
Investors could benefit from holding bonds across fixed income asset classes, including high yield. “Average annual returns for the high-yield market historically are approximately 6% to 8%. We are again at a starting yield level where these returns could be achieved, with a multi-year investment horizon, which is the first time this has been true in a while,” says Capital Group fixed income portfolio manager Tara Torrens. “However, the path from here to there could be very bumpy.”
Bonds historically have had positive results following rate hikes
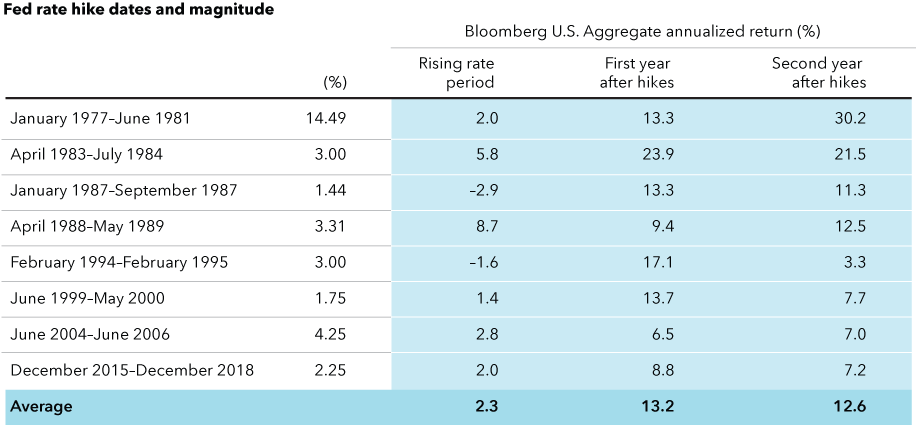
Sources: Capital Group, Bloomberg, RIMES, U.S. Federal Reserve. Data as of June 15, 2022.
There are also opportunities in EM debt. Several countries have raised rates ahead of the Fed and are on solid financial footing, according to Capital Group fixed income portfolio manager Rob Neithart. Given the nuances of EM investing, this is an area where being active and selective are especially critical.
Higher municipal bond yields improve tax break-evens
The outlook for municipal bonds is positive as well. Like the rest of the bond market, much of the pain of rising yields may already be priced in. Based on historical data, returns may improve going forward: Since 1980, municipal bonds, as represented by the Bloomberg Municipal Bond Index, averaged a loss of about 4.4% in down years, but then saw an average annualized return of 9.3% in the five years following such down years (data from Bloomberg as of May 31, 2022).
“After starting 2022 with very rich market conditions, yields rose sharply and credit premiums became more attractive,” notes Chad Rach, a portfolio manager at Capital Group. “Although we may not have reached rock-bottom prices just yet, I view most munis as much more reasonably valued than just a few months ago and want to position portfolios to reflect those favorable adjustments.”
The lift in yields on muni bonds carries a hidden advantage: It lowers their break-even point relative to taxable bonds and makes them potentially attractive even for investors who are not in the highest tax brackets.
Pricing in the pain
Future Fed rate hikes may already be largely priced into bonds. Based on futures markets, investors expect 2- and 10-year U.S. Treasury yields to rise only another 0.11% to 0.40% over the next year.
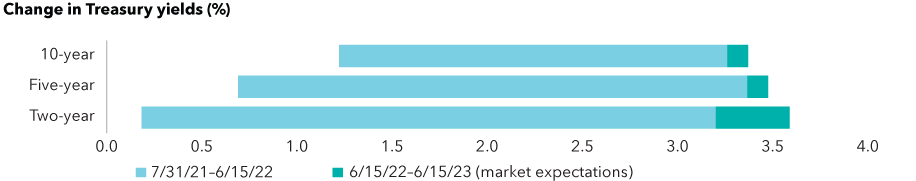
Sources: Capital Group, Bloomberg, RIMES, U.S. Federal Reserve. Data as of June 15, 2022.
Sharpen your focus on today’s opportunities
Although the current investment environment seems to be permeated with risk and uncertainty, the historic realignment that is underway is setting the stage for future growth. There are things to be positive about, and opportunities abound in both equity and fixed income markets. This is a time when it pays to be prudent and selective, but not timid. Advisors are in a good position to guide their clients in adjusting portfolios to take advantage of the environment on both macro and micro levels.
As you examine your clients’ portfolios for potential areas of risk and opportunity, Capital Group’s portfolio consultants may be able to help identify specific areas to focus on. Consider scheduling a portfolio consultation with one of our specialists today.
Learn more about
To read the full article, become an RIA Insider. You'll also gain complimentary access to news, insights, tools and more.
Already an Insider?
Investments are not FDIC-insured, nor are they deposits of or guaranteed by a bank or any other entity, so they may lose value.
Statements attributed to an individual represent the opinions of that individual as of the date published and do not necessarily reflect the opinions of Capital Group or its affiliates. This information is intended to highlight issues and should not be considered advice, an endorsement or a recommendation.
All Capital Group trademarks mentioned are owned by The Capital Group Companies, Inc., an affiliated company or fund. All other company and product names mentioned are the property of their respective companies.
Use of this website is intended for U.S. residents only.
American Funds Distributors, Inc.
This content, developed by Capital Group, home of American Funds, should not be used as a primary basis for investment decisions and is not intended to serve as impartial investment or fiduciary advice.
Bloomberg U.S. Aggregate Index represents the U.S. investment-grade fixed-rate bond market.
Bloomberg U.S. Corporate Investment Grade Index represents the universe of investment grade, publicly issued U.S. corporate and specified foreign debentures and secured notes that meet the specified maturity, liquidity, and quality requirements. Bloomberg U.S. Corporate High Yield Index covers the universe of fixed-rate, non-investment-grade debt.
Bloomberg Municipal Bond Index is a market-value-weighted index designed to represent the long-term investment-grade tax-exempt bond market.
50%/50% JP Morgan EMBI Global/JP Morgan GBI-EM Global Diversified blends the JP Morgan EMBI Global Index with the JP Morgan GBI-EM Global Diversified Index by weighting their cumulative total returns at 50% each. This assumes the blend is rebalanced monthly.
For financial professionals only. Not for use with the public.
Investments are not FDIC-insured, nor are they deposits of or guaranteed by a bank or any other entity, so they may lose value.
Investing outside the United States involves risks, such as currency fluctuations, periods of illiquidity and price volatility. These risks may be heightened in connection with investments in developing countries.
Lower rated bonds are subject to greater fluctuations in value and risk of loss of income and principal than higher rated bonds.
The value of fixed income securities may be affected by changing interest rates and changes in credit ratings of the securities.
While not directly correlated to changes in interest rates, the values of inflation-linked bonds generally fluctuate in response to changes in real interest rates and may experience greater losses than other debt securities with similar durations.
The return of principal for bond funds and for funds with significant underlying bond holdings is not guaranteed. Fund shares are subject to the same interest rate, inflation and credit risks associated with the underlying bond holdings.
Unlike mutual fund shares, investments in U.S Treasuries are guaranteed by the U.S. government as to the payment of principal and interest. In addition, certificates of deposit (CDs) are FDIC-insured and, if held to maturity, offer a guaranteed return of principal.
There may have been periods when the results lagged the index(es) and/or average(s).
The indexes are unmanaged and, therefore, have no expenses. Investors cannot invest directly in an index.
Source: Bloomberg Index Services Limited. BLOOMBERG® is a trademark and service mark of Bloomberg Finance L.P. and its affiliates (collectively "Bloomberg"). Bloomberg or Bloomberg's licensors own all proprietary rights in the Bloomberg Indices. Neither Bloomberg nor Bloomberg's licensors approves or endorses this material, or guarantees the accuracy or completeness of any information herein, or makes any warranty, express or implied, as to the results to be obtained therefrom and, to the maximum extent allowed by law, neither shall have any liability or responsibility for injury or damages arising in connection therewith.
MSCI has not approved, reviewed or produced this report, makes no express or implied warranties or representations and is not liable whatsoever for any data in the report. You may not redistribute the MSCI data or use it as a basis for other indices or investment products.
This report, and any product, index or fund referred to herein, is not sponsored, endorsed or promoted in any way by J.P. Morgan or any of its affiliates who provide no warranties whatsoever, express or implied, and shall have no liability to any prospective investor, in connection with this report. J.P. Morgan disclaimer: https://www.jpmm.com/research/disclosures
Each S&P Index ("Index") shown is a product of S&P Dow Jones Indices LLC and/or its affiliates and has been licensed for use by Capital Group. Copyright © 2024 S&P Dow Jones Indices LLC, a division of S&P Global, and/or its affiliates. All rights reserved. Redistribution or reproduction in whole or in part is prohibited without written permission of S&P Dow Jones Indices LLC.
Statements attributed to an individual represent the opinions of that individual as of the date published and do not necessarily reflect the opinions of Capital Group or its affiliates. This information is intended to highlight issues and should not be considered advice, an endorsement or a recommendation.
All Capital Group trademarks mentioned are owned by The Capital Group Companies, Inc., an affiliated company or fund. All other company and product names mentioned are the property of their respective companies.
Use of this website is intended for U.S. residents only.
American Funds Distributors, Inc.
This content, developed by Capital Group, home of American Funds, should not be used as a primary basis for investment decisions and is not intended to serve as impartial investment or fiduciary advice.