Interest Rates
Categories
Markets & Economy
Are we nearing a market bottom?
 Darrell Spence
 Jared Franz
 Jens Søndergaard
October 11, 2022
U.S. stocks posted their third straight quarter of losses for the first time since 2009. With a recession looming in the United States, and probably already underway in Europe, it’s tough to see a catalyst for a durable, near-term market rebound, even with the early fourth-quarter rally. Stocks and bonds are likely to come under further pressure as long as the U.S. Federal Reserve and other central banks continue to aggressively tighten monetary policy.
Markets took another leg down after the Fed delivered its third consecutive 75 basis points (bps) rate hike last month, lifting the federal funds rate to a target range of 3.00% to 3.25%, the highest level since 2008. The Fed’s latest projections show it intends to take rates above 4.50% in the months ahead, and Fed officials have warned they would continue to tighten monetary policy to tame inflation.
At some point, the impact of higher rates and deteriorating economic conditions will bleed into corporate earnings, says Capital Group economist Darrell Spence. “While equity markets have declined, expectations for corporate earnings are likely still too high,” Spence explains.
A number of companies have already issued downbeat outlooks or announced plans to rein in spending by imposing hiring freezes or outright workforce reductions, or halting capital projects. This includes Nike, FedEx, Ford and some high-profile technology giants such as Meta Platforms and Alphabet.
“Consensus market expectations are for earnings to grow in 2023. However, if the economy does enter a recession, earnings could easily fall 15%, or even more, considering the strong dollar and rising labor costs,” said Spence. “As such, there seems to be some potential for downward revisions to consensus earnings estimates.”
Equities may fall further before they recover
A 15% decline in earnings would put the estimated price-to-earnings ratio for the S&P 500 Index in the range of 19 to 20. “In an environment where interest rates are rising, and the 10-year Treasury yield could potentially exceed 4.0%, history suggests a price-to-earnings multiple in the mid-teens would be more appropriate,” said Spence. “The combination of lower consensus earnings estimates and multiple compression could present a difficult headwind for the equity market.”
In a challenging environment for equities, it’s worth looking for areas that have fared relatively well in periods of market decline. Historically, dividend-paying stocks tend to do better than the broader market, according to Capital Group economist Jared Franz. “In terms of individual sectors, it's historically staples, health care and utilities that have held up well.”
Stocks and bonds have tumbled this year as the Fed fights inflation
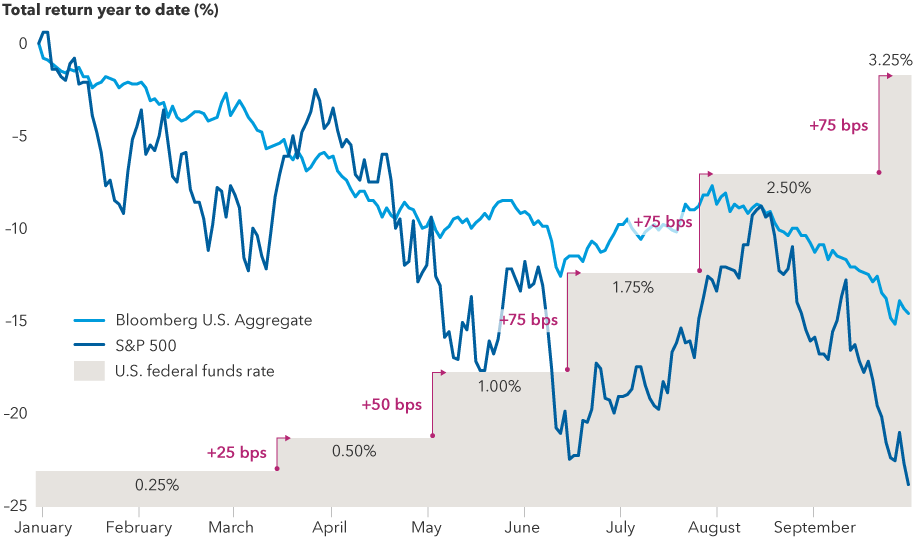
Sources: Capital Group, Bloomberg, Refinitiv Datastream, Standard & Poor’s. As of September 30, 2022.
Moreover, while equity markets broadly may not have touched bottom, many portfolio managers are starting to find value in select areas of the market.
Based on the trajectory of past downturns, bear markets associated with a recession have a median decline of about 36% and tend to last, on average, about 18 months. So, it wouldn’t be unusual for this one to continue well into 2023. That said, using deep, fundamental research, many portfolio managers and analysts are starting to see opportunities to invest in good companies at attractive prices.
The U.S. economy is healthier compared to Europe, Japan and China, which have been beleaguered by Russia’s escalation of the war in Ukraine, energy supply disruptions, severe COVID-19 restrictions, global supply chain dislocations and controversial fiscal policies by the United Kingdom’s new government. U.S. consumer spending has proven to be resilient, and the labor market has remained robust. Nevertheless, parts of the economy appear to be weakening. Incoming homebuilder data are weak, and these data are good leading indicators for sales, starts and prices. Indeed, the S&P CoreLogic Case-Shiller U.S. National Home Price NSA Index registered a monthly decline in July, the first since 2019 and largest since 2012. When housing turns lower in a late cycle, as it is now, a recession has tended to follow.
Interest rates hikes shift into overdrive
Sticky inflation — components of the consumer price index (CPI) that have been historically slow to change — suggests that the Fed will be pressured to continue with large rate hikes in its November and December meetings. The latest “dot plot” projections back this up, showing Fed officials anticipate raising rates as high as 4.6% in 2023.
Sticky inflation indexes are accelerating
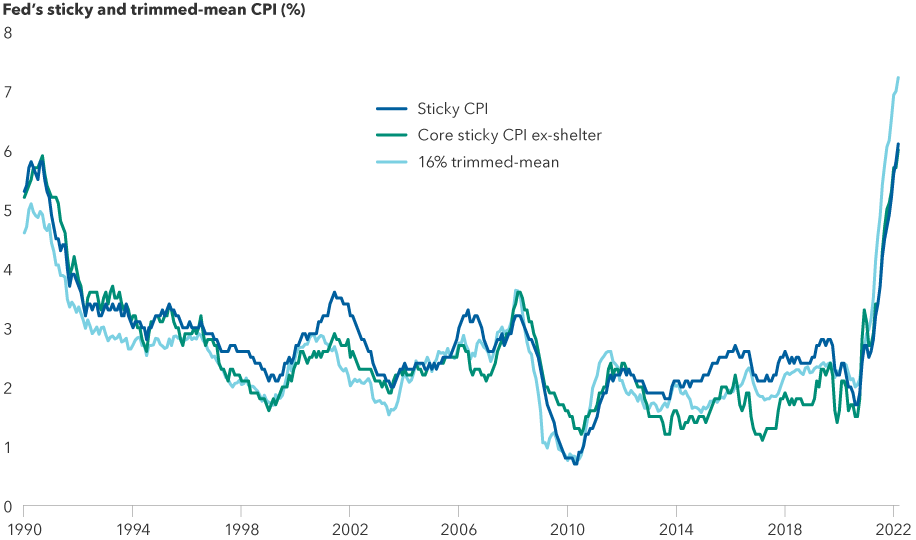
Sources: Capital Group, Federal Reserve Bank of Atlanta, Federal Reserve Bank of Cleveland. Data as of September 20, 2022. CPI = consumer price index. The “sticky” and “core sticky ex-shelter” CPI, published by the Atlanta Fed, show the change in price among components of the consumer price index that have been historically slow to change. The 16% trimmed-mean CPI, published by the Cleveland Fed, is a weighted average of one-month inflation rates of components whose expenditure weights fall below the 92nd percentile and above the 8th percentile of price changes.
Markets have also moved rapidly in recent weeks and priced in an additional 100 bps of Fed tightening. Interest rate futures are reflecting the federal funds rate peaking in the 4.50%–4.75% range. “While the market has made progress in pricing in how high policy rates may need to go in this tightening cycle, Treasury yields could potentially still move higher,” Spence said.
The renewed correlation between the 10-year Treasury bond yield and changes in the expected fed funds rate helps bear out this view, he added. During periods of 0% interest rates, the correlation between the two rates has tended to break down as expectations for the federal funds rate remained pegged near zero. Since last year, as the fed funds rate rose from 0%, the 10-year Treasury bond yield once again tracked changes in expectations for that rate.
“I believe the Fed is going to have to bring short-term rates probably up close to 5%, and at a minimum 4.5%. And we still don't know if that's going to be enough to bring down inflation,” said fixed income portfolio manager Pramod Atluri. “My expectation is for the 10-year Treasury yield to touch 4% again at some point. And that would be a yield level where I would consider adding duration, or interest rate exposure. It may overshoot a little bit, but 4% or slightly higher could be the peak in 10-year Treasury yields.”
Bond yields could go higher
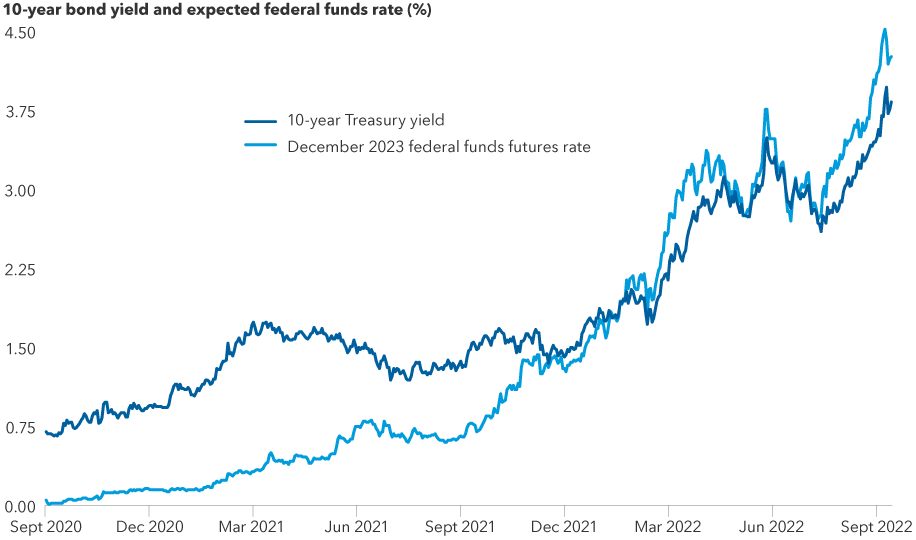
Sources: Federal Reserve, CME, Bloomberg. Data as of September 30, 2022.
Dollar strength is likely to persist
In the third quarter, the euro reached parity with the dollar, while the British pound tumbled to an all-time low, the yen hit a 24-year low, and China’s yuan reached a 14-year low. While the dollar’s rapid rise this year has likely pushed it into overvalued territory, current conditions do not indicate a reversal in the dollar.
The dollar’s relative value is also being supported by weakness in the British pound.
“Clearly, we are in deep overshooting territory now, but there are very good reasons,” said Capital Group currency analyst Jens Søndergaard. The Bank of England stepped in to support U.K. bonds given the size of the losses that U.K. pension funds have been facing.
“It’s not clear whether markets have fully grasped the second- or third-order impact of these large bond losses facing pension funds, not just in U.K. but in Europe too," Søndergaard said. “There are some early signs of financial market distress, and we need to be very mindful of this in the coming months. Since the British pound is a highly pro-cyclical currency, it looks vulnerable to further weakness.
“For now, the current macroeconomic outlook — with a more resilient U.S. and much weaker Europe and China — is clearly positive for the U.S. dollar,” Søndergaard said.
A reversal in the dollar would likely require some combination of an end to U.S. monetary tightening, a resolution to the Russia-Ukraine conflict and a pickup in Chinese growth. While none of these factors appear set to change soon, once they do, Søndergaard said, “I would expect the FX (foreign exchange) market reaction to be very sharp, and the dollar could weaken very quickly.”
The U.S. dollar's swift ascent
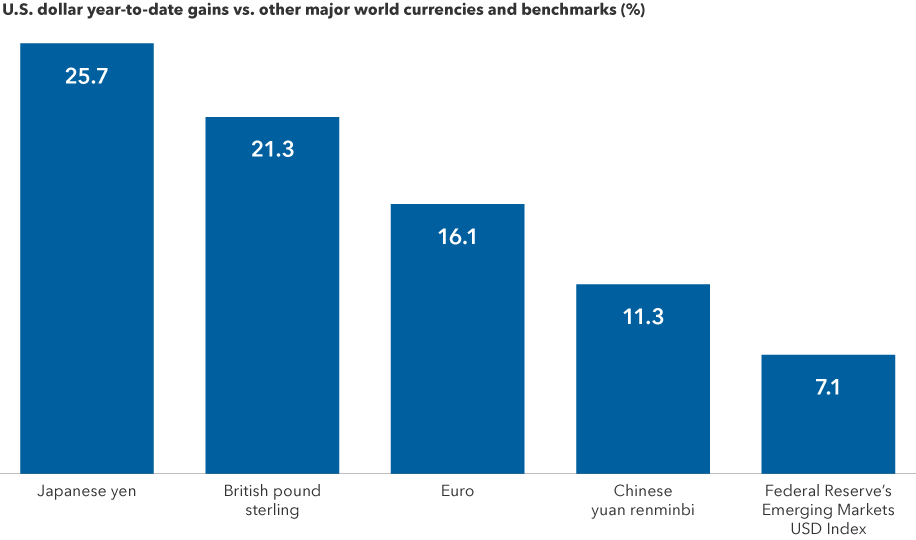
Sources: Capital Group, ICE Data Services, MSCI, RIMES, Federal Reserve. As of September 30, 2022.
Any dollar decline could be especially pronounced against emerging markets (EM) currencies. Many emerging markets’ central banks got a head start on hiking interest rates and have been more aggressive than their major developed market counterparts. As a result, EM real interest rates are attractive relative to developed markets.
Learn more about
The S&P 500 Index is a market capitalization-weighted index based on the results of approximately 500 widely held common stocks.
The Bloomberg U.S. Aggregate Index represents the U.S. investment-grade fixed-rate bond market.
The S&P CoreLogic Case-Shiller Home Price Indices are calculated monthly using a three-month moving average. Index levels are published with a two-month lag and are released at 9 am EST on the last Tuesday of every month. Index performance is based on non-seasonally adjusted data.
The Trade-Weighted U.S. Dollar Index, also known as the Nominal Broad-Dollar Index, is a creation of the U.S. Federal Reserve Bank. It is used to measure the value of the U.S. dollar against currencies widely used in international trade, rather than against all currencies.
Investments are not FDIC-insured, nor are they deposits of or guaranteed by a bank or any other entity, so they may lose value.
Investors should carefully consider investment objectives, risks, charges and expenses.
This and other important information is contained in the fund prospectuses and summary prospectuses, which can be obtained from a financial professional and should be read carefully before investing.
Statements attributed to an individual represent the opinions of that individual as of the date published and do not necessarily reflect the opinions of Capital Group or its affiliates. This information is intended to highlight issues and should not be considered advice, an endorsement or a recommendation.
All Capital Group trademarks mentioned are owned by The Capital Group Companies, Inc., an affiliated company or fund. All other company and product names mentioned are the property of their respective companies.
Use of this website is intended for U.S. residents only.
On or around July 1, 2024, American Funds Distributors, Inc. will be renamed Capital Client Group, Inc.
This content, developed by Capital Group, home of American Funds, should not be used as a primary basis for investment decisions and is not intended to serve as impartial investment or fiduciary advice.