Interest Rates
Categories
Markets & Economy
5 keys to investing in 2023
 Pramod Atluri
 Caroline Randall
 Andrew Suzman
January 9, 2023
Investors are more than ready to turn the page on a turbulent 2022 — an unprecedented year in most of our lives. Inflation soared. Central banks aggressively increased interest rates, reversing a 40-year cycle of falling rates. Asset prices tumbled, and war broke out in Ukraine.
What’s next for 2023? Heading into the new year, inflation remains elevated, the war in Ukraine drags on, and with recession looming in the U.S. and abroad, investors will likely see additional market volatility. Some of these developments are seismic shifts that will likely reshape the investment landscape for years to come.
The new year no doubt will bring its own unique set of opportunities. Whichever way the wind blows, here are five key actions investors can take to help them stay on track and navigate the challenges that lie ahead.
1. Make dividends a bigger part of your portfolio
During the recent bull market, investors had to get one thing right: Recognize that leading U.S. internet companies with strong growth potential could generate the greatest returns.
In today’s more volatile markets, with the cost of capital rising and investors less eager to pay up for high-multiple growth stocks, dividends are getting more attention. “We are at the start of what I expect will be a renewed and durable appreciation of the role dividends can play in investor portfolios,” says Caroline Randall, a portfolio manager with Capital Income Builder®. “Going forward, dividends should be a more significant and stable contributor to total returns.”
While dividends accounted for a slim 16% of total return for the S&P 500 Index in the 2010s, historically they have contributed 38% on average. In the inflationary 1970s they climbed to more than 70%. “When you expect growth in the single digits, dividends can give you a head start,” Randall adds. “They may also offer a measure of downside protection when volatility rises.”
Dividends have historically been a larger percentage of total return
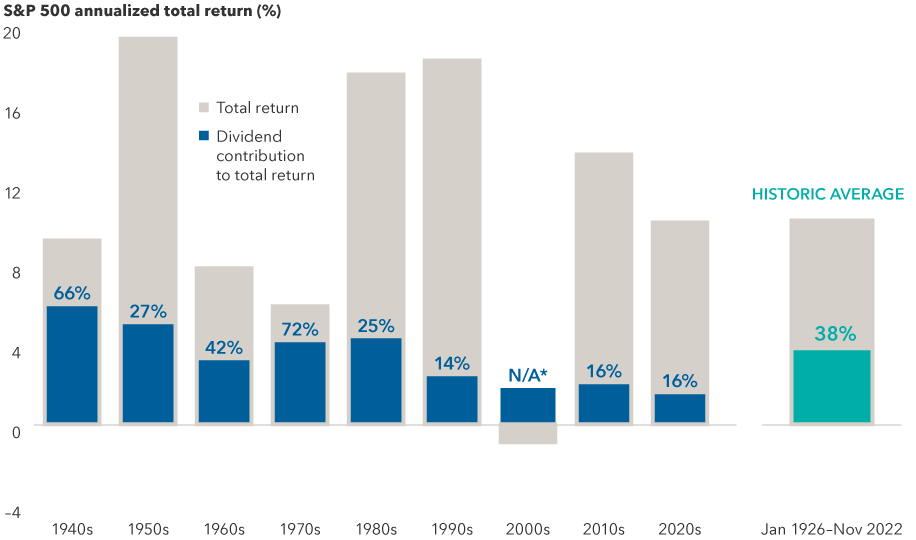
Source: S&P Dow Jones Indices LLC. 2020s data is from 1/1/2020 through 11/30/2022. *Total return for the S&P 500 Index was negative for the 2000s. Dividends provided a 1.8% annualized return over the decade. Past results are not predictive of results in future periods.
Of course, not all dividends are created equal. During the pandemic, for example, many companies reduced or eliminated dividend payments. That is why it is essential to understand the sustainability of dividends and invest selectively, Randall notes. “I closely scrutinize company management actions to gauge how committed they are to maintaining and growing dividends over time.”
Companies that have paid steady and above-market dividends can be found across the financial, energy, materials and health care sectors, among others. For example, UnitedHealth Group, the largest private provider of managed health care to Americans, has grown its dividend and likely will continue to do so even in a tougher economy, Randall says.
In many markets outside the U.S., dividends have historically made up an even bigger part of the investment landscape. As of October 31, 2022, about 600 companies headquartered in international and emerging markets, as measured by the MSCI All Country World ex USA Index, offered hefty dividend yields between 3% and 6%, compared to only 121 in the United States.
2. Seek more from your international stocks
For years, maintaining sizable investments in international stocks has required patience and a strong stomach. After all, returns for non-U.S. markets have persistently lagged the U.S. amid waves of disappointing economic and geopolitical developments.
A look at news headlines suggests more of the same in 2023. A strong U.S. dollar, the war in Ukraine, and weak economies in Europe, Japan and emerging markets have created a cloudy near-term outlook.
That said, in many cases much of this news is priced into markets, explains Andrew Suzman, a portfolio manager with EuroPacific Growth Fund®. “Strong global businesses in Europe and Asia are trading at what I believe are compelling valuations. If the news simply gets less bad, shares for many of them could rebound.”
Investors would also do well to remember that there’s a difference between top-down macroeconomic conditions and the fundamental, bottom-up prospects for individual companies. Now more than ever, company-specific developments are driving returns outside the U.S., placing added importance on rigorous investment research and individual stock picking.
Company-specific factors have had a large and growing impact on returns
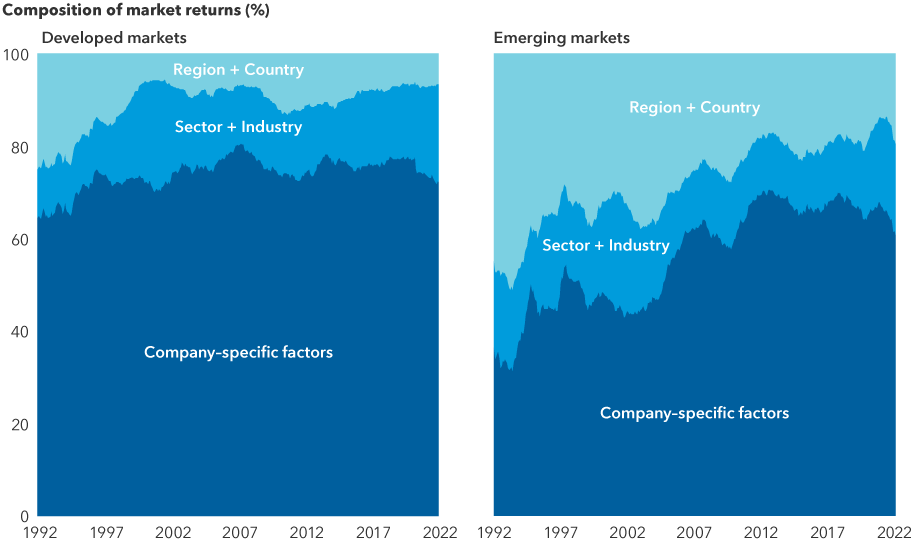
Source: Empirical Research Partners. As of 9/30/22. Analysis provided by Empirical Research Partners using their developed market and emerging market stock universes that approximate the MSCI World Index and MSCI Emerging Markets Index, respectively. Data shows the percentage of market returns that can be attributed to various factors over time, using a two-year smoothed average. A smoothed moving average is a method of reducing short-term fluctuations in data and is calculated by using a weighted average of values (based on the entire period) applied over a specified period of time (in this case two years) on a rolling basis. Past results are not predictive of results in future periods.
For many multinational companies headquartered in struggling economic areas, national conditions often have little or no impact on revenues, except perhaps when it comes to regulation and taxes.
Consider, for example, luxury eyewear maker EssilorLuxottica. “This is an Italian company, but it sells eyewear in the U.S., Asia and across Europe,” Suzman says. “Its prospects have little to do with the Italian economy and a lot to do with global demand for luxury goods.” Similarly, interest in European aircraft maker Airbus has more to do with travel demand in the U.S. and China.
Likewise in emerging markets, interest in Taiwan Semiconductor Manufacturing Company reflects the universal demand for computer chips, according to Gerald du Manoir, principal investment officer for American Funds® International Vantage Fund. “Granted, the outlook for some economies doesn’t look too compelling, but I feel confident that we can still find promising companies in Europe, Japan and emerging markets.”
3. Strengthen your core bond portfolio
In 2022, core bond portfolios failed to do what was expected: fulfill their traditional role as a ballast against market volatility. In a year when global stocks slid 14.5%, investment-grade bonds (BBB/Baa and above) declined 12.8%.
It is understandable if investors are disappointed, but outcomes like this have been rare. In fact, last year was the only time in the past 45 years that stocks and bonds fell in tandem. The conditions that led to this outcome also have been rare. At a time when rates were near or below zero, the U.S. Federal Reserve and other major central banks initiated a series of aggressive rate hikes to tamp down inflation.
Stocks and bonds have rarely declined in tandem
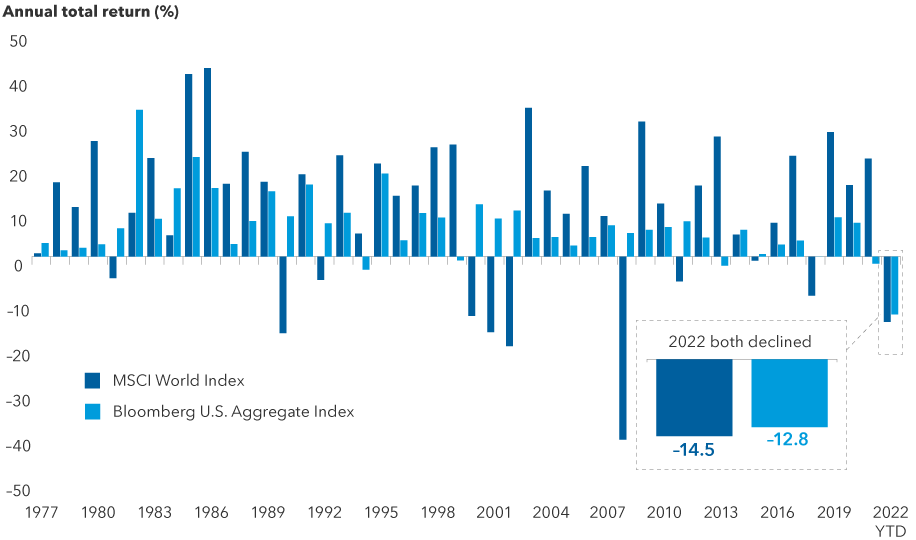
Sources: Capital Group, Bloomberg Index Services Ltd., MSCI. Returns above reflect annual total returns in USD for all years except 2022, which reflect the year-to-date total return for both indexes. As of 11/30/2022. Past results are not predictive of results in future periods.
That should change in 2023. Inflation has already shown signs of slowing. At its December meeting, the Fed moderated its approach and lifted rates by just a half percentage point to a range of 4.25% to 4.50%. But officials underscored that they will continue to raise rates, with the potential to go above 5% next year. Further evidence of slower inflation or slowing growth could allow the Fed to further slow or pause its rate hikes.
“I believe we are close to that point,” says Pramod Atluri, fixed income portfolio manager. “Once the Fed eases, high-quality bonds should again offer relative stability and greater income.”
Core bond allocations should generally have a place in diversified portfolios, but they become more important as recession concerns take center stage. “I am seeing more opportunities now that bonds have repriced lower,” Atluri says. “Valuations are attractive, so I am selectively adding corporate credit. Bonds now offer a much healthier income stream, which should help offset any price declines.”
Go deeper:
- Bond market outlook: Prospects brighten as Fed slows hikes
- Webinar on demand: Bond market opportunities in 2023
- Not all fixed income provides balance. Does your bond allocation prioritize it?
4. Tap into credit markets for higher income
There is an upside to the painful bond market losses of 2022. Declining bond prices set the stage for higher income going forward.
The yield on the benchmark 10-year U.S. Treasury was 3.88% on December 30, 2022, versus a yield of 1.51% on December 31, 2021. Yields, which rise when bond prices fall, have soared across sectors. Over time, income should increase since the total return of a bond fund consists of price changes and interest paid, and the interest component is higher.
Yields have soared across asset classes
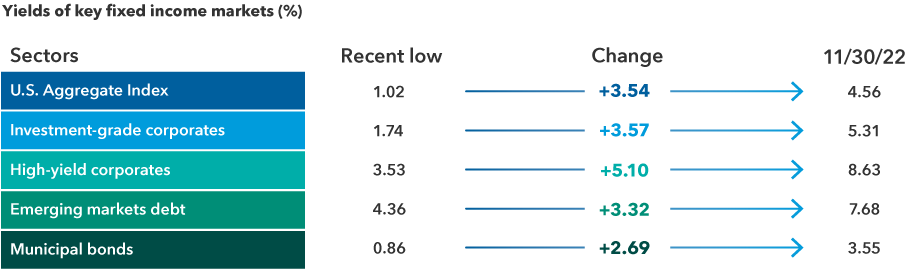
Sources: Bloomberg, Bloomberg Index Services Ltd., JPMorgan. As of 11/30/22. Sector yields above include Bloomberg U.S. Aggregate Index, Bloomberg U.S. Corporate Investment Grade Index, Bloomberg U.S. Corporate High Yield Index, 50% J.P. Morgan EMBI Global Diversified Index/50% J.P. Morgan GBI-EM Global Diversified Index blend and Bloomberg Municipal Bond Index. Period of time considered from 2020 to present. Dates for recent lows from top to bottom in chart shown are: 8/4/20, 12/31/20, 7/6/21, 1/4/21 and 7/27/21. Yields shown are yield to worst. Yield to worst is the lowest yield that can be realized by either calling or putting on one of the available call/put dates or holding a bond to maturity. "Change" figures may not reconcile due to rounding. Past results are not predictive of results in future periods.
With investors better compensated for holding relatively stable bonds, the question of whether to invest in riskier corporate or high-yield bonds ahead of a potential recession is an important one.
One surprising element has been the resilience of consumers. Despite gloomy headlines, consumers continue to open their wallets. Consumer spending accounts for roughly 70% of the economy, and spending has been relatively resilient despite high inflation.
“This has helped keep corporate balance sheets in pretty good shape,” says Damien McCann, fixed income portfolio manager for American Funds® Multi-Sector Income Fund.
The reward potential for corporate investment-grade bonds at current levels is enticing, but many are vulnerable in a downturn. “I expect credit quality to weaken as the economy slows. In that environment, I prefer defensive sectors such as health care over homebuilders and retail,” McCann adds.
5. Don’t sit on the sidelines
A steady drumbeat of bad news can be discouraging to even the most seasoned investors.
But well-managed companies adjust to shifting conditions, and ultimately the best companies have learned to thrive in the new reality. Markets themselves have a history of adjusting to setbacks. Indeed, stock markets historically have recovered before a recession ends, anticipating a better future ahead. If history is a guide, they could rebound about six months before the economy does.
What is important for investors is to stick with their long-term investment plans. Abrupt and dramatic change often triggers powerful emotions that can lead to impulsive action, like moving cash to the sidelines. From May 2022 through the end of the year, investors shifted about $160 billion into money market funds, according to the Office of Financial Research. But taking your money out of the market on the way down means that if you don’t get back in at exactly the right time, you can’t capture the full benefit of a recovery.
Missing just a few of the market’s best days can hurt investment returns
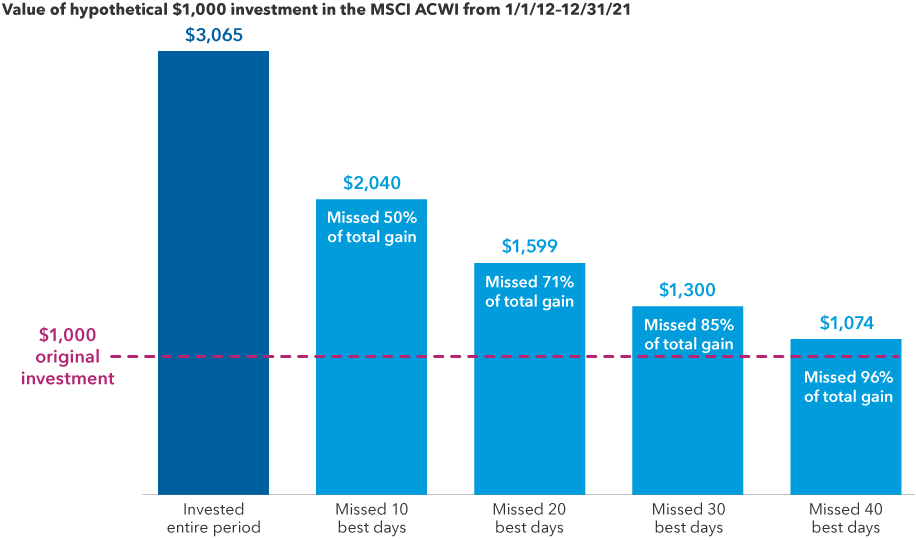
Sources: Capital Group, MSCI, RIMES. As of 12/31/21. MSCI returns above reflect total returns, including the impact of reinvested dividends.
Even missing a few trading days can take a toll. Consider an example of a hypothetical $1,000 investment in the MSCI ACWI from January 1, 2012, to December 31, 2021. An investment for the full period would have grown to $3,065. But missing even the 10 best days of the subsequent 10 years would have significantly hurt long-term results — and the more missed “good” days, the more missed opportunities.
The strongest gains have often occurred immediately after a bottom. Therefore, waiting on the sidelines for an economic turnaround is not a recommended strategy.
“No one will blow a bugle to give the all-clear signal,” Suzman adds. “So I am looking beyond the near-term challenges and seeking companies that I believe represent good value over the next few years. After major moves in the stock market, it could be time to review your portfolio to ensure it is well-diversified, reflects the right level of risk and is aligned with your investment objectives.
Learn more about
Investing outside the United States involves risks, such as currency fluctuations, periods of illiquidity and price volatility, as more fully described in the prospectus. These risks may be heightened in connection with investments in developing countries.
The return of principal for bond funds and for funds with significant underlying bond holdings is not guaranteed. Fund shares are subject to the same interest rate, inflation and credit risks associated with the underlying bond holdings. Lower rated bonds are subject to greater fluctuations in value and risk of loss of income and principal than higher rated bonds. Income from municipal bonds may be subject to state or local income taxes and/or the federal alternative minimum tax. Certain other income, as well as capital gain distributions, may be taxable. While not directly correlated to changes in interest rates, the values of inflation linked bonds generally fluctuate in response to changes in real interest rates and may experience greater losses than other debt securities with similar durations. The use of derivatives involves a variety of risks, which may be different from, or greater than, the risks associated with investing in traditional cash securities, such as stocks and bonds. Bond ratings, which typically range from AAA/Aaa (highest) to D (lowest), are assigned by credit rating agencies such as Standard & Poor's, Moody's and/or Fitch, as an indication of an issuer’s creditworthiness. If agency ratings differ, the security will be considered to have received the highest of those ratings, consistent with the fund’s investment policies.
The indexes are unmanaged and, therefore, have no expenses. Investors cannot invest directly in an index.
Bloomberg U.S. Aggregate Index represents the U.S. investment-grade fixed-rate bond market.
Bloomberg U.S. Corporate Investment Grade Index represents the universe of investment grade, publicly issued U.S. corporate and specified foreign debentures and secured notes that meet the specified maturity, liquidity and quality requirements.
Bloomberg U.S. Corporate High Yield Index covers the universe of fixed-rate, non-investment grade-debt.
Bloomberg Municipal Bond Index is a market value-weighted index designed to represent the long-term investment-grade tax-exempt bond market.
JP Morgan Emerging Markets Bond Index (EMBI) Global Diversified is a uniquely weighted emerging market debt benchmark that tracks total returns for U.S. dollar-denominated bonds issued by emerging market sovereign and quasi-sovereign entities. JP Morgan Government Bond Index — Emerging Markets (GBI-EM) Global Diversified covers the universe of regularly traded, liquid fixed-rate, domestic currency emerging market government bonds to which international investors can gain exposure. The 50%/50% JP Morgan EMBI Global/JP Morgan GBI-EM Global Diversified Index blends the JP Morgan EMBI Global Index with the JP Morgan GBI-EM Global Diversified Index by weighting their cumulative total returns at 50% each. This assumes the blend is rebalanced monthly.
MSCI ACWI is a free float-adjusted market capitalization-weighted index that is designed to measure equity market results in the global developed and emerging markets, consisting of more than 40 developed and emerging market country indexes.
MSCI All Country World ex USA Index is a free float-adjusted market capitalization-weighted index designed to measure equity market results in the global developed and emerging markets, excluding the United States. The index consists of more than 40 developed and emerging market country indexes.
MSCI Emerging Markets Index captures large- and mid-cap representation across 27 emerging markets (EM) countries.
MSCI World Index is a free float-adjusted market capitalization-weighted index designed to measure equity market results of developed markets. The index consists of more than 20 developed market country indexes, including the United States.
The S&P 500 Index is a market capitalization-weighted index based on the results of approximately 500 widely held common stocks.
BLOOMBERG® is a trademark and service mark of Bloomberg Finance L.P. and its affiliates (collectively “Bloomberg”). Bloomberg or Bloomberg’s licensors own all proprietary rights in the Bloomberg Indices. Neither Bloomberg nor Bloomberg’s licensors approves or endorses this material, or guarantees the accuracy or completeness of any information herein, or makes any warranty, expressed or implied, as to the results to be obtained therefrom, and, to the maximum extent allowed by law, neither shall have any liability or responsibility for injury or damages arising in connection therewith.
This report, and any product, index or fund referred to herein, is not sponsored, endorsed or promoted in any way by J.P. Morgan or any of its affiliates who provide no warranties whatsoever, express or implied, and shall have no liability to any prospective investor, in connection with this report. J.P. Morgan disclaimer:
https://www.jpmm.com/research/disclosures.
MSCI has not approved, reviewed or produced this report, makes no express or implied warranties or representations and is not liable whatsoever for any data in the report. You may not redistribute the MSCI data or use it as a basis for other indices or investment products.
The S&P 500 Index is a product of S&P Dow Jones Indices LLC and/or its affiliates and has been licensed for use by Capital Group. Copyright © 2023 S&P Dow Jones Indices LLC, a division of S&P Global, and/or its affiliates. All rights reserved. Redistribution or reproduction in whole or in part are prohibited without written permission of S&P Dow Jones Indices LLC.
Statements attributed to an individual represent the opinions of that individual as of the date published and do not necessarily reflect the opinions of Capital Group or its affiliates. This information is intended to highlight issues and should not be considered advice, an endorsement or a recommendation.
All Capital Group trademarks mentioned are owned by The Capital Group Companies, Inc., an affiliated company or fund. All other company and product names mentioned are the property of their respective companies.
Use of this website is intended for U.S. residents only.
On or around July 1, 2024, American Funds Distributors, Inc. will be renamed Capital Client Group, Inc.
This content, developed by Capital Group, home of American Funds, should not be used as a primary basis for investment decisions and is not intended to serve as impartial investment or fiduciary advice.
This report, and any product, index or fund referred to herein, is not sponsored, endorsed or promoted in any way by J.P. Morgan or any of its affiliates who provide no warranties whatsoever, express or implied, and shall have no liability to any prospective investor, in connection with this report. J.P. Morgan disclaimer: https://www.jpmm.com/research/disclosures.
Investing outside the United States involves risks, such as currency fluctuations, periods of illiquidity and price volatility. These risks may be heightened in connection with investments in developing countries.
Investments are not FDIC-insured, nor are they deposits of or guaranteed by a bank or any other entity, so they may lose value.
Investors should carefully consider investment objectives, risks, charges and expenses.
This and other important information is contained in the fund prospectuses and summary prospectuses, which can be obtained from a financial professional and should be read carefully before investing.
Statements attributed to an individual represent the opinions of that individual as of the date published and do not necessarily reflect the opinions of Capital Group or its affiliates. This information is intended to highlight issues and should not be considered advice, an endorsement or a recommendation.
All Capital Group trademarks mentioned are owned by The Capital Group Companies, Inc., an affiliated company or fund. All other company and product names mentioned are the property of their respective companies.
Use of this website is intended for U.S. residents only.
On or around July 1, 2024, American Funds Distributors, Inc. will be renamed Capital Client Group, Inc.
This content, developed by Capital Group, home of American Funds, should not be used as a primary basis for investment decisions and is not intended to serve as impartial investment or fiduciary advice.