Investment Fund

Share Class

Summary

Internal Prompt
International growth with a dividend focus. Invests primarily in well-established dividend-paying companies outside of the U.S., including the emerging markets, which can help reduce volatility.
Price at NAV $36.74 as of 4/15/2024 (updated daily)
Fund Assets (millions) $15,203.8
Portfolio Managers
7
Expense Ratio
(Gross/Net %)
0.91 / 0.91%

Internal Prompt

Returns at NAV

Returns with Sales Charge

Read important investment disclosures
6.92%
1-year return
5.61%
5-year return
3.46%
10-year return
2.19%
30-Day SEC Yield
Returns as of 3/31/24 (updated monthly). Yield as of 3/31/24 (updated monthly).

Asset Mix

U.S. Equities4.2%
Non-U.S. Equities92.3%
U.S. Bonds0.0%
Non-U.S. Bonds0.0%
Cash & Equivalents
3.6%
As of 3/31/2024 (updated monthly)

Growth of 10K

Read important investment disclosures
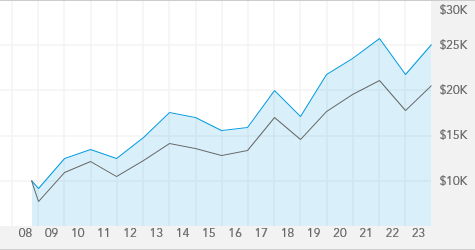
For Class A Shares, this chart tracks a hypothetical investment with dividends reinvested, over the last 20 years, or since inception date if the fund has been in existence under 20 years, through 12/31/2023.
IGAAX
MSCI All Country World Index (ACWI) ex USA

High & Low Prices

Market Capitalization

87.6%
Large
11.7%
Medium
0.7%
Small
$50,371.00 Million
Weighted Average


As of 12/31/2023 (updated quarterly). Morningstar data as of 12/31/2023 (updated quarterly).

Morningstar Ownership ZoneTM

Foreign Large Blend
Weighted average of holdings
75% of fund's stock holdings
Morningstar data as of 12/31/23 (updated quarterly)

Description

Fund Objective
The fund's investment objective is to provide you with long-term growth of capital while providing current income.
Distinguishing Characteristics
This fund invests primarily in companies outside of the U.S., including the emerging markets. It focuses on well-established companies with strong earnings that often pay dividends, which can help reduce volatility.
Types of Investments
Primarily common stocks and equity-type securities as well as some fixed-income securities.
Portfolio Restrictions
Generally, will invest at least 90% of its assets in issuers whose securities are listed primarily on exchanges outside the United States, cash, cash equivalents and securities held as collateral issued by U.S. issuers.

Fund Facts

Fund Inception 10/01/2008
Fund Assets (millions)
As of 2/29/2024
$15,203.8
Companies/Issuers
Holdings are as of 3/31/2024 (updated monthly).
249+
Shareholder Accounts
Shareholder accounts are as of 3/31/2024
238,778
Regular Dividends Paid
Mar, Jun, Sep, Dec
Minimum Initial Investment $250
Capital Gains Paid
Dec
Portfolio Turnover (2023) 31%
Fiscal Year-End Jun
Prospectus Date 09/01/2023
CUSIP 45956T 10 5
Fund Number 34

Returns

Internal Prompt

Month-End Returns as of 3/31/24

Quarter-End Returns as of 3/31/24

Internal Prompt

Volatility & Return

Read important investment disclosures

Equities

For Class A Shares, this chart tracks the 10-year standard deviation
and 10-year annualized return of the equity funds
IGAAX
MSCI All Country World Index (ACWI) ex USA
Other AF Funds
Standard Deviation as of 03/31/2024 (updated monthly) . Annualized return as of 03/31/2024 (updated monthly) .
VIEW LARGER CHART
Internal Prompt

Yield

12-month
Distribution Rates
30-day SEC Yield
Fund at NAV 2.28% N/A
Fund at MOP 2.15% 2.19%
As of 3/31/2024 (updated monthly)

Valuation

Price/ Price/ Price/
Book Cash Flow Earnings
Fund 1.66 7.82 12.05
MSCI All Country World Index (ACWI) ex USA
1.60 7.50 12.80
Fund as of 12/31/23. Index as of 12/31/23.

Portfolio Management

Years of Experience with Fund
Years of Experience with Capital Group
Years of Experience with Investment Industry
Barbara Burtin 0 15
Michael Cohen 5 24 32
Patrice Collette 13 24 29
Leo Hee 8 19 31
Andrew B. Suzman 15 30
Lisa Thompson 5 29 36
Steven T. Watson 15 34 36
A boldface number indicates that years of experience with Capital Group is equal to years of experience with investment industry.

Ratings & Risk

Morningstar Rating TM


Overall Morningstar RatingTM
Funds rated(696)
3-yr. Morningstar RatingTM
(696 funds rated)
5-yr. Morningstar RatingTM
(646 funds rated)
10-yr. Morningstar RatingTM
(425 funds rated)
Overall Morningstar Risk Average
HIGH
LOW
Category Foreign Large Blend
Ratings are based on risk-adjusted returns as of 3/31/2024 (updated monthly).

Risk Measures

Fund
Standard Deviation
15.28
Sharpe Ratio
0.24
For the 10 Years ending 3/31/24 (updated monthly).
American Funds/
Morningstar Benchmark
MSCI ACWI Ex USA NR USD
R-squared 95
Beta 0.99
Capture Ratio (Downside/Upside) 99/99
American Funds and Morningstar Benchmark for the 10 Years ending 3/31/24 (updated monthly).
Active Share
68.2%
As of 12/31/23 (updated quarterly)

Holdings

Equities Breakdown

Equity Fund Holdings
Financials 18.3%
Industrials 15.5%
Information technology 14.1%
Consumer discretionary 10.2%
Consumer staples 8.6%
Health care 8.6%
Communication services 6.7%
Energy 5.3%
Materials 4.9%
Utilities 2.4%
Real estate 1.8%

% of net assets as of 3/31/2024 (updated monthly)

Top Equities

TSMC
3.3%
Novo Nordisk
3.0%
ASML
2.5%
AstraZeneca
2.3%
Airbus
2.3%
TotalEnergies
2.1%
BAE Systems
1.6%
MediaTek
1.6%
AXA
1.6%
Publicis Groupe
1.3%

% of net assets as of 3/31/2024 (updated monthly)

Geographic Breakdown

United States
4.2%
Europe
56.0%
Asia & Pacific Basin
26.9%
Other (Including Canada & Latin America)
9.4%
Cash & equivalents
3.6%
% of net assets as of 3/31/2024 (updated monthly)

The New Geography of Investing ®

Regions Fund
MSCI All Country World Index (ACWI) ex USA
United States 4.3% 0.0%
Canada 4.3% 7.6%
Europe 58.2% 42.7%
Japan 7.7% 15.3%
Asia-Pacific ex. Japan 4.6% 6.8%
Emerging Markets 20.9% 27.6%

% of net assets as of 3/31/2024 (updated monthly)

Fund Breakdown by Domicile

Regions Fund
MSCI All Country World Index (ACWI) ex USA
United States 4.2% 0.0%
Canada 4.1% 7.6%
Europe 56.1% 42.7%
Japan 7.5% 15.3%
Asia-Pacific ex. Japan 4.4% 6.8%
Emerging Markets 20.2% 27.6%
Cash & Equivalents
3.6% 0.0%

% of net assets as of 3/31/2024 (updated monthly)

Prices & Distributions

Internal Prompt

Historical Prices Month-End

Historical Prices Year-End

Internal Prompt

Historical Distributions as of 04/15/24

2024
Record
Date
Calculated
Date
Pay Date
Income Dividend Regular
Income Dividend Special
Cap. Gains Long-Term
Cap. Gains Short-Term
Reinvest NAV
03/22/24 03/22/24 03/25/24 $0.182 $0.00 $0.00 $0.00 $37.65
2024 Year-to-Date: Dividends Subtotal: $0.182 Cap Gains Subtotal: $0.00
Total Distributions: $0.182

Fees & Expenses

Internal Prompt

Fees

Annual Management Fees 0.48%
Other Expenses 0.19%
Service 12b-1 0.24%
As of each fund's most recent prospectus.
Internal Prompt

Expense Ratio

IGAAX 0.91%
Lipper International Funds Average
1.19%
Fund as of most recent prospectus. Lipper Category as of 3/31/24 (updated quarterly).

Resources