EXCHANGE-TRADED FUNDS

How to put our ETFs to
work in portfolios

7 ways to use our equity and fixed income ETFs now

Implementation ideas

4 ways our bond ETFs may help in the current environment

LEARN MORE

Meet the suite

Active ETFs that seek better outcomes in a variety of markets

LEARN MORE

EQUITIES

Ideas for using active ETFs to pursue key investment themes

Select a category to go directly to that implementation idea: 

Large valueLarge growthGlobal large-stock growth

Large value

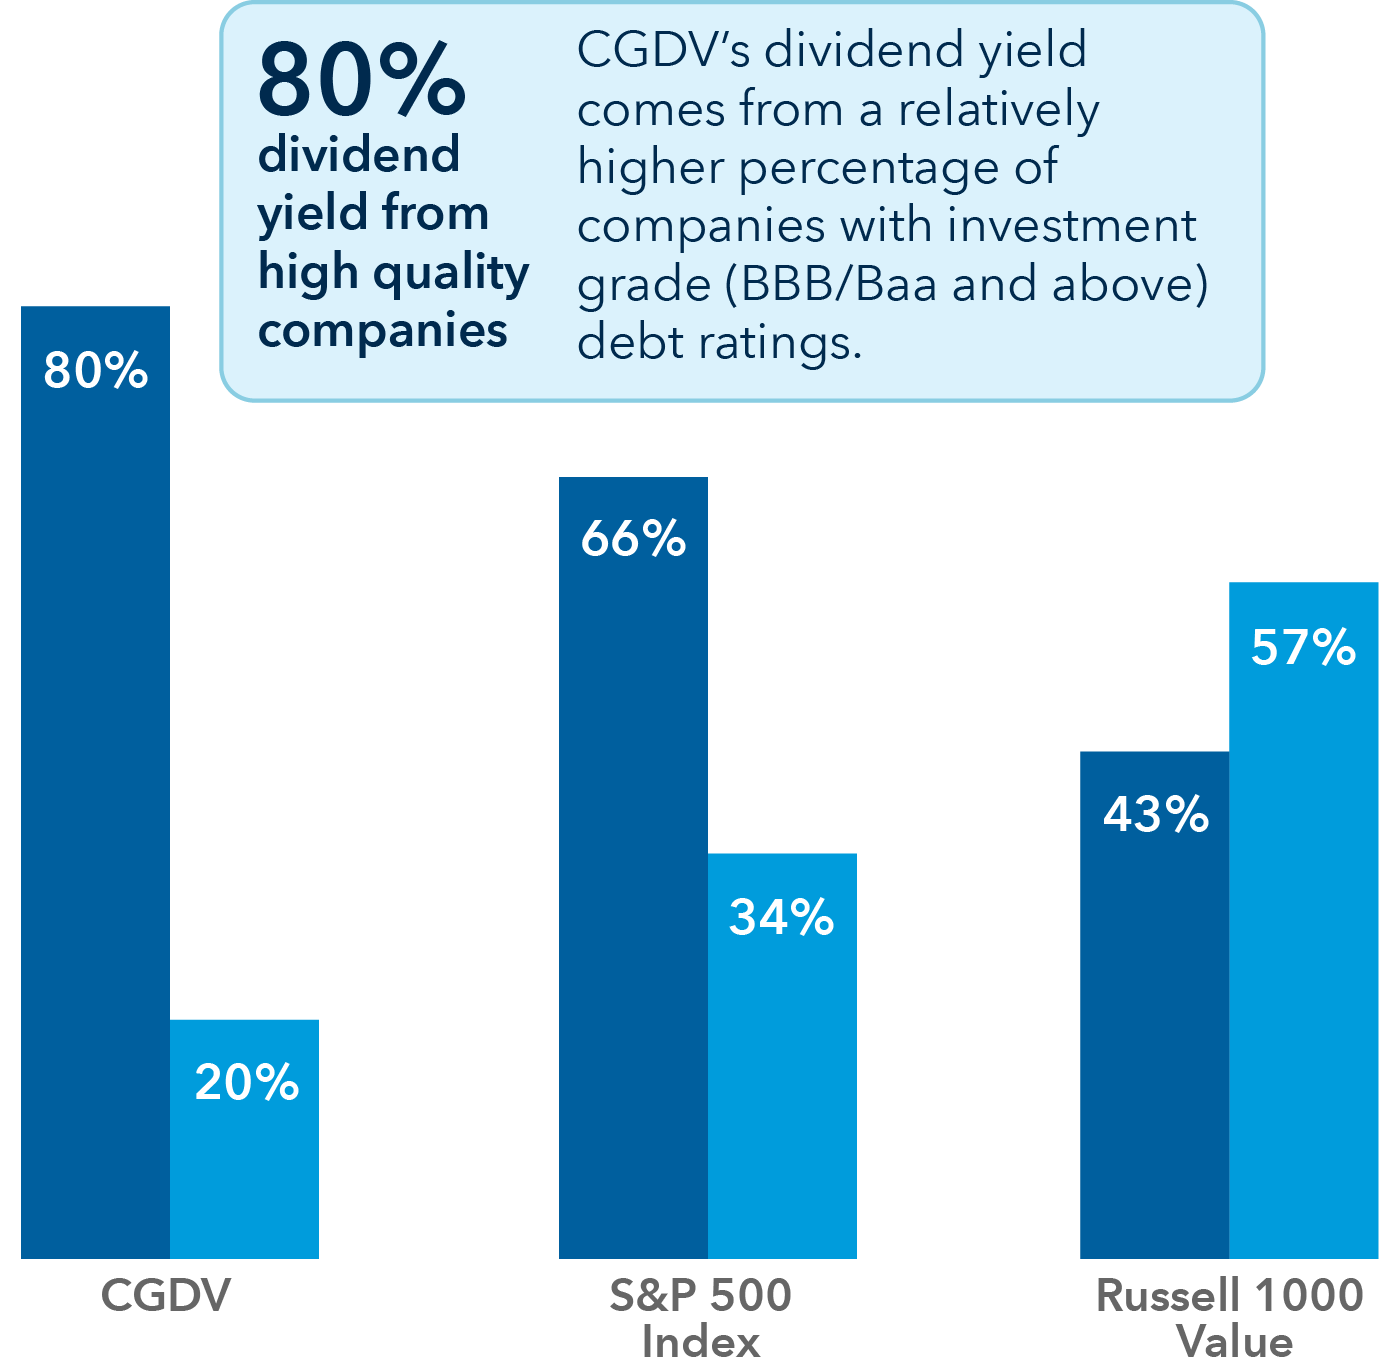
Pursue consistent income by focusing on companies that pay dividends

  High quality

  Low quality/no rating

Data as of March 31, 2023. See disclosure1 

Visual shows a bar chart with three pairs of vertical bars, one navy blue and one sky blue. The navy blue bars represent high-quality (that is, the companies contributing the dividends have an investment-grade debt rating, defined as BBB/Baa and above), and the sky blue portion represents low quality or no rating.  There’s text within the chart that says, “80% dividend yield from high quality companies” and a separate section that says, “CGDV’s dividend yield comes from a relatively higher percentage of companies with investment grade (BBB/Baa and above) debt ratings.” The first bar represents the dividend composition of CGDV, which shows 80% of the dividend yield coming from high-quality companies and 20% from low-quality or unrated companies. The second bar represents the S&P 500 Index. 66% of its dividend yield comes from high-quality companies and 34% comes from low-quality or unrated companies. The third bar represents the Russell 1000 Value Index. 43% of its dividend yield comes from high-quality companies and 57% comes from low-quality or unrated companies.


See disclosure 1

Well-established U.S. companies with a history of financial strength and regular dividend payments may not be exciting but their potential payouts could be. Consider Capital Group Dividend Value ETF (CGDV), which aims to invest in companies that are capable of paying dividends across a variety of market and economic environments.

Large growth

Expand your definition of growth to avoid limiting your opportunity set

  CGGR

  Russell 1000 Growth Index

Data as of March 31, 2023. See disclosure2 

Visual shows a bar chart comparing the geographic breakdown for CGGR compared with its secondary benchmark, the Russell 1000 Growth Index. The chart title says, “Country breakdown by domicile (%).” CGGR is represented by a dark blue color and the Russell 1000 Growth Index is represented by the light blue color. The first set of horizontal bars on the chart show 85.09% of CGGR’s holdings are based in the U.S compared with 99.8% for the Russell 1000 Growth Index. The second set of horizontal bars on the chart show 6.3% of CGGR’s holdings are based in emerging markets compared with 0.1% for the Russell 1000 Growth Index. The third set of horizontal bars on the chart show 4% of CGGR’s holdings are based in Europe compared with 0% for the Russell 1000 Growth Index. The fourth set of horizontal bars on the chart show 2.4% of CGGR’s holdings are based in Canada compared with 0% for the Russell 1000 Growth Index. The remaining 1.4% of CGGR are in cash and equivalents. There’s text within the chart that says, “CGGR has the flexibility to seek capital appreciation across different geographies, giving it the opportunity to invest where many index-based ETFs don’t.”


See disclosure 2

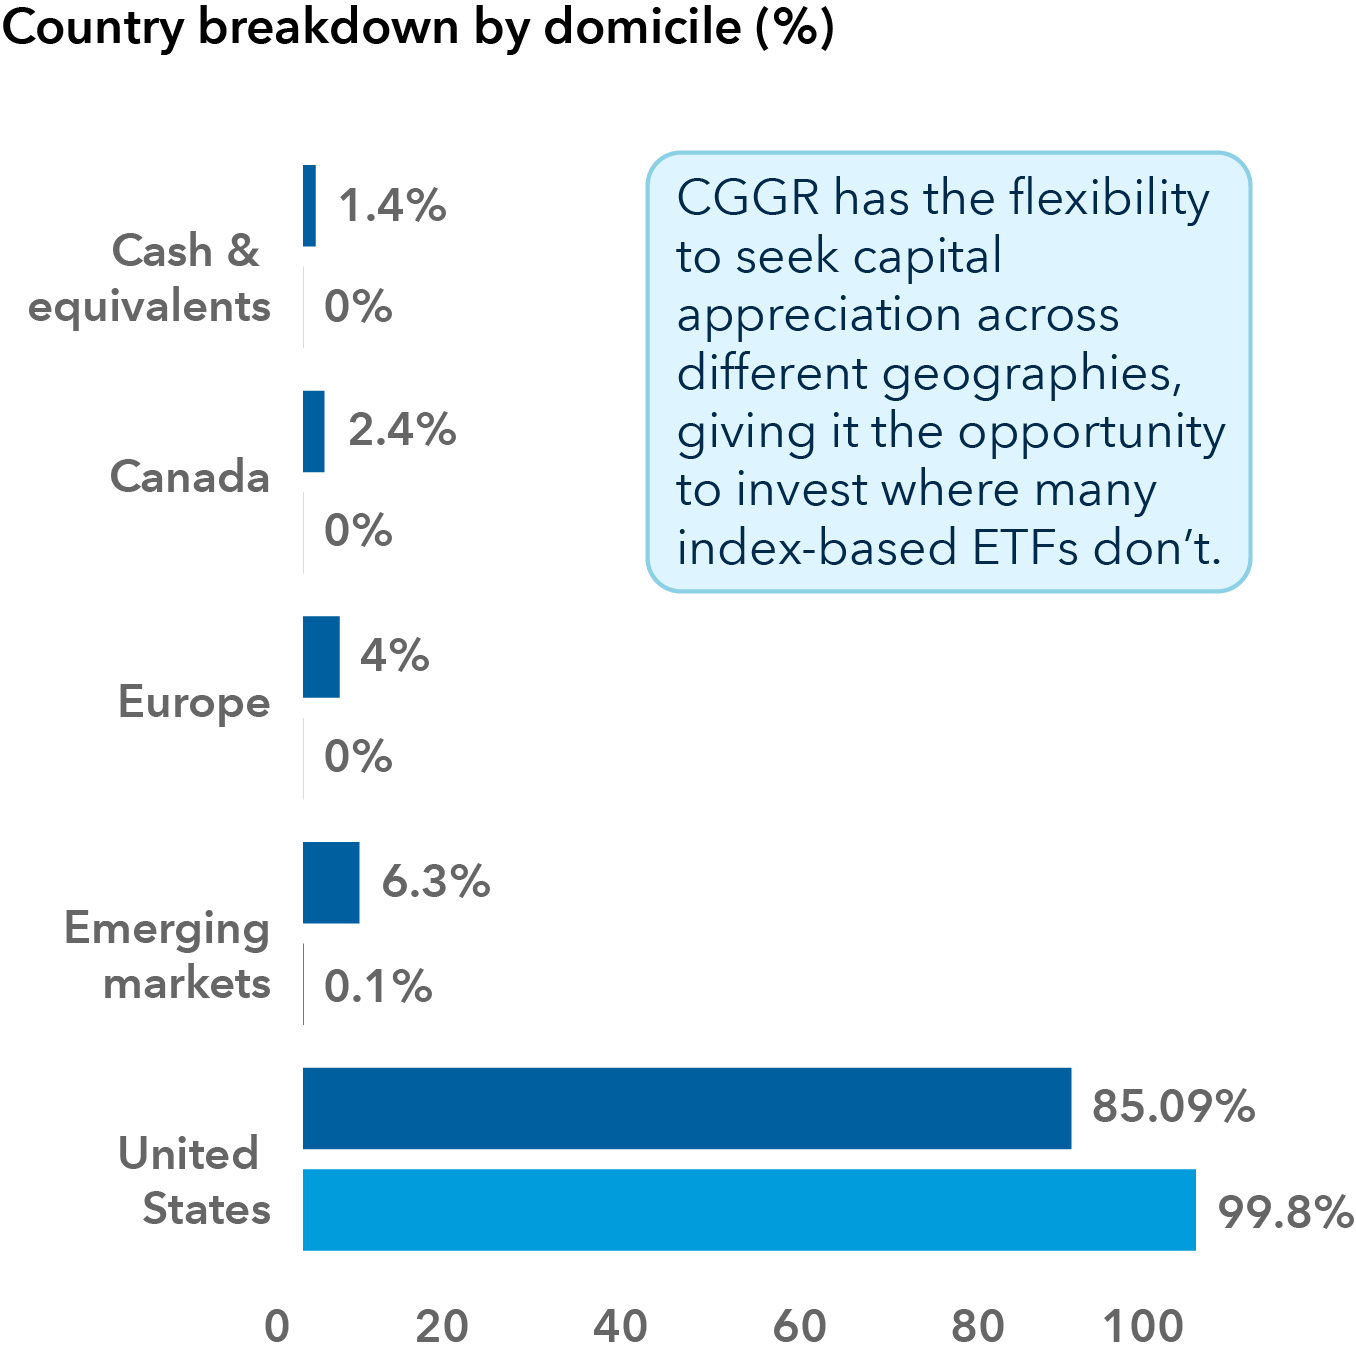
Growth can take many forms, which is why Capital Group Growth ETF (CGGR) has the flexibility to invest in a variety of opportunities, including developing industries, cyclical companies in a slow period or non-U.S. domiciled companies that are industry leaders. 

Global large-stock growth

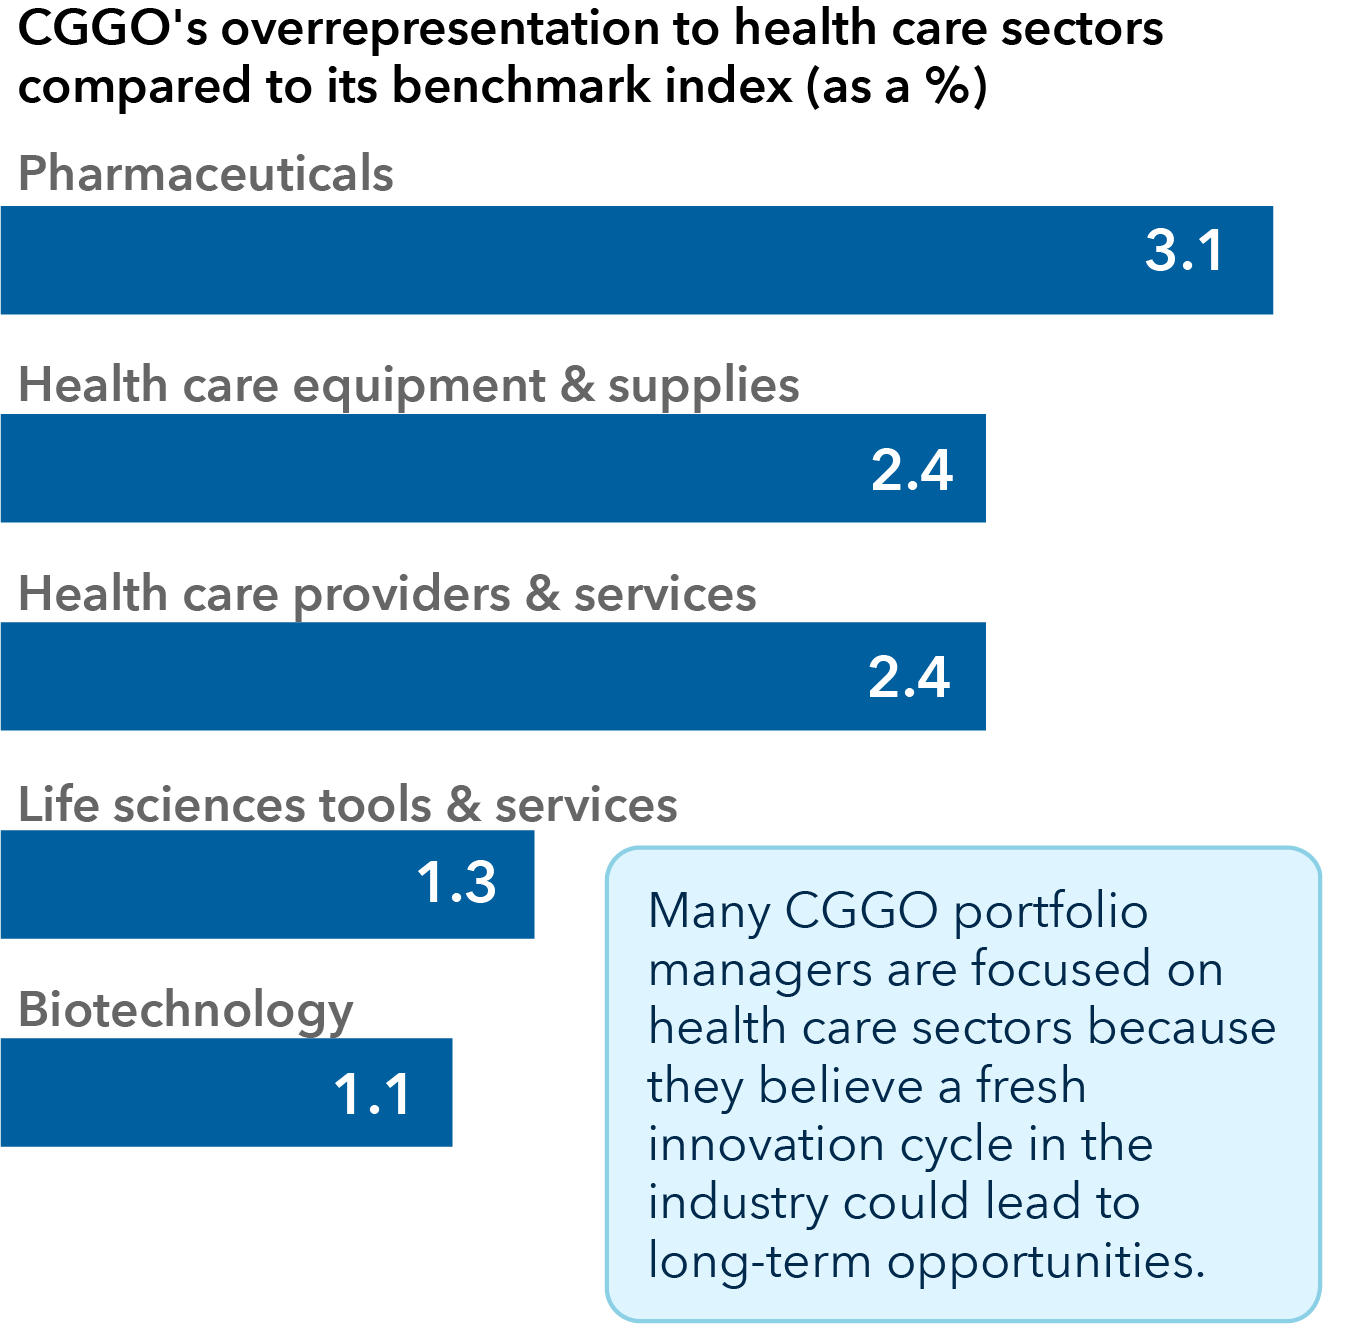
Pursue growth wherever it’s found — because innovation isn’t limited to one sector or region


Data as of March 31, 2023. See disclosure3

There’s a bar chart with five navy blue horizontal bars and text above the chart that says, “CGGO’s overrepresentation to health care sectors compared to its benchmark index (as a %).” The first bar says, “Pharmaceuticals: 3.1.” The second bar says, “Health care equipment & supplies: 2.4.” The third bar says, “Health care providers and services: 2.4.” The fourth bar says, “Life sciences tools and services: 1.3.” The fifth bar says, “Biotechnology: 1.1. There’s text within the chart that says: ”Many CGGO portfolio managers are focused on health care sectors because they believe a fresh innovation cycle in the industry could lead to long-term opportunities.”


See disclosure 3

Within Capital Group Global Growth ETF (CGGO), innovation isn't limited to a specific industry, region or company size. Its geographic flexibility allows portfolio managers to identify attractive opportunities, no matter where they’re located, what industry they’re in or the size of the company.

Disclosure 1
Source: Factset as of March 31, 2023. The indexes used in this comparison represent the fund’s primary benchmark, the S&P 500 Index (a market capitalization-weighted index based on the results of approximately 500 widely held common stocks) and the fund’s secondary benchmark, the Russell 1000 Value Index (a market capitalization-weighted index that represents the large-cap value segment of the U.S. equity market and includes stocks from the Russell 1000 Index that have lower price-to-book ratios and lower expected growth rates). High quality percentage prefers to the number of holdings as a percent of the total holdings whose debt rating is investment grade (BBB/Baa and above). Bond ratings, which typically range from AAA/Aaa (highest) to D (lowest), are assigned by credit rating agencies such as Standard & Poor’s, Moody’s and/or Fitch, as an indication of an issuer’s creditworthiness. Low quality/no rating reflects the percentage of companies with below investment grade debt (BB/Ba and below) or whose debt is not rated by ratings agencies.

Disclosure 2
As of March 31, 2023. Source: Capital Group, FTSE/Russell indexes. The index used in this comparison represent the fund’s secondary benchmark, the Russell 1000 Value Index. Cash and equivalents includes short-term securities, accrued income and other assets less liabilities. It may also include investments in money market or similar funds managed by the investment adviser or its affiliates that are not offered to the public.

Disclosure 3
As of March 31, 2023. Source: Capital Group, MSCI. The index used in this comparison represent the fund’s primary benchmark, the MSCI All Country World Index (a free float-adjusted market capitalization-weighted index that is designed to measure equity market results in the global developed and emerging markets, consisting of more than 40 developed and emerging market country indexes). Data reflects only equity holdings within the portfolio and excludes cash and equivalents (short-term securities).

FIXED INCOME

Active fixed income ETFs built for times like these

Select a category to go directly to that implementation idea:

Short durationCore plusMultisectorMunis

Short duration

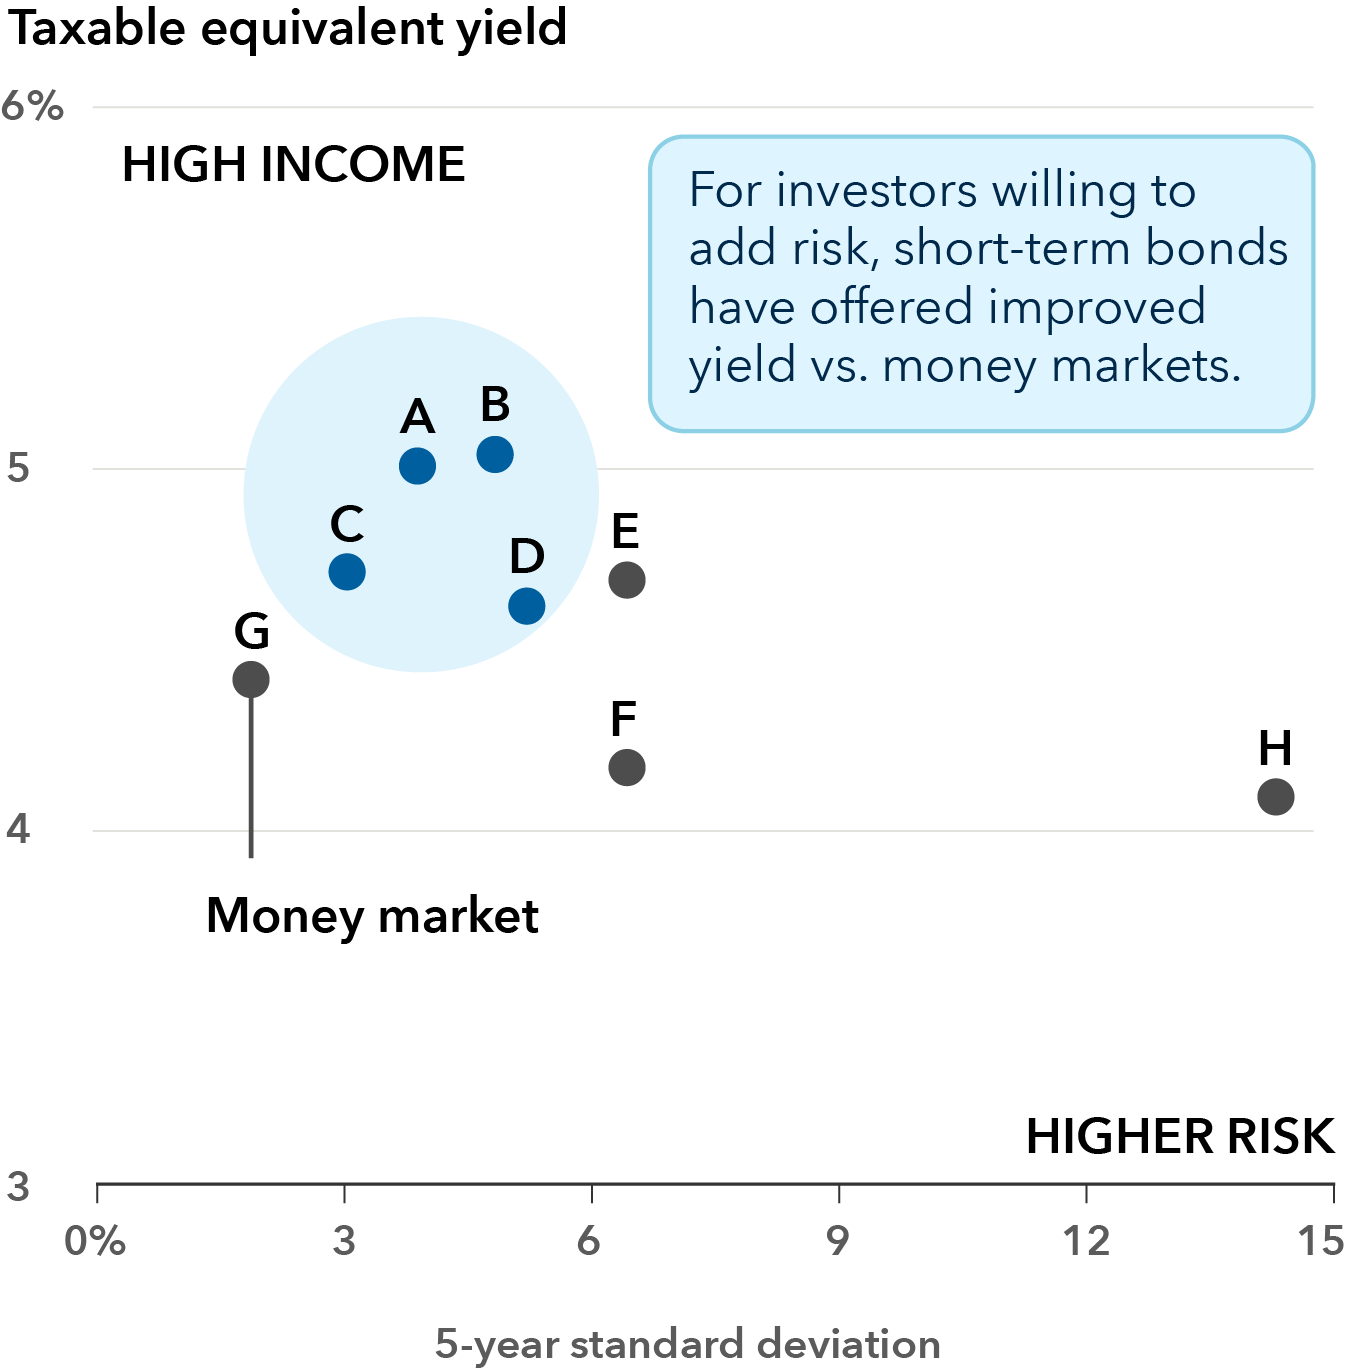
Pursue short-term bond income with low interest rate sensitivity

A. 1-5 year municipal

E. Core

B. 1-10 year municipal

F. Treasury

C. 1-3 year taxable

G. Money market

D. Intermediate taxable

H. Long Treasury

Data as of December, 31, 2022. See disclosure4

A chart that shows taxable equivalent yield on the y-axis measuring from 3% to 6% with a label near 6% that says higher return and 5-year standard deviation on the x-axis measuring from 0% to 15% with a label near 15% that says higher risk. The values are marked with dots and letters A-H. A indicates 1-5 year municipal, B indicates 1-10 year municipal, C indicates 1-3 year taxable, D indicates intermediate taxable, E indicates core, F indicates Treasury, G indicates money market and H indicates long Treasury. The dots for values A through D are green and encompassed by a light blue circle next to text that says “For investors willing to add risk, short-term bonds have offered improved yield vs. money markets.” These values are near the 5% taxable equivalent yield line and within the 0-3% values on the x-axis. The G dot, indicating the money market, is the lowest risk (near 0% 5-year standard deviation) and the tax equivalent yield is at about 4.5%. The H dot, indicating long Treasury has the highest risk at just below 15% on the x-axis and a tax equivalent yield slightly above 4%. This is the lowest yield shown on the chart. 1-year municipals and 1-10 year municipals have the highest taxable equivalent yields on the chart on or slightly above the 5% line and are around 2-3% on the x-axis.


See disclosure 4

Consider moving excess cash and money market holdings into Capital Group Short Duration Income ETF (CGSD), a short-duration fixed income ETF that aims to pursue income with low interest rate exposure.
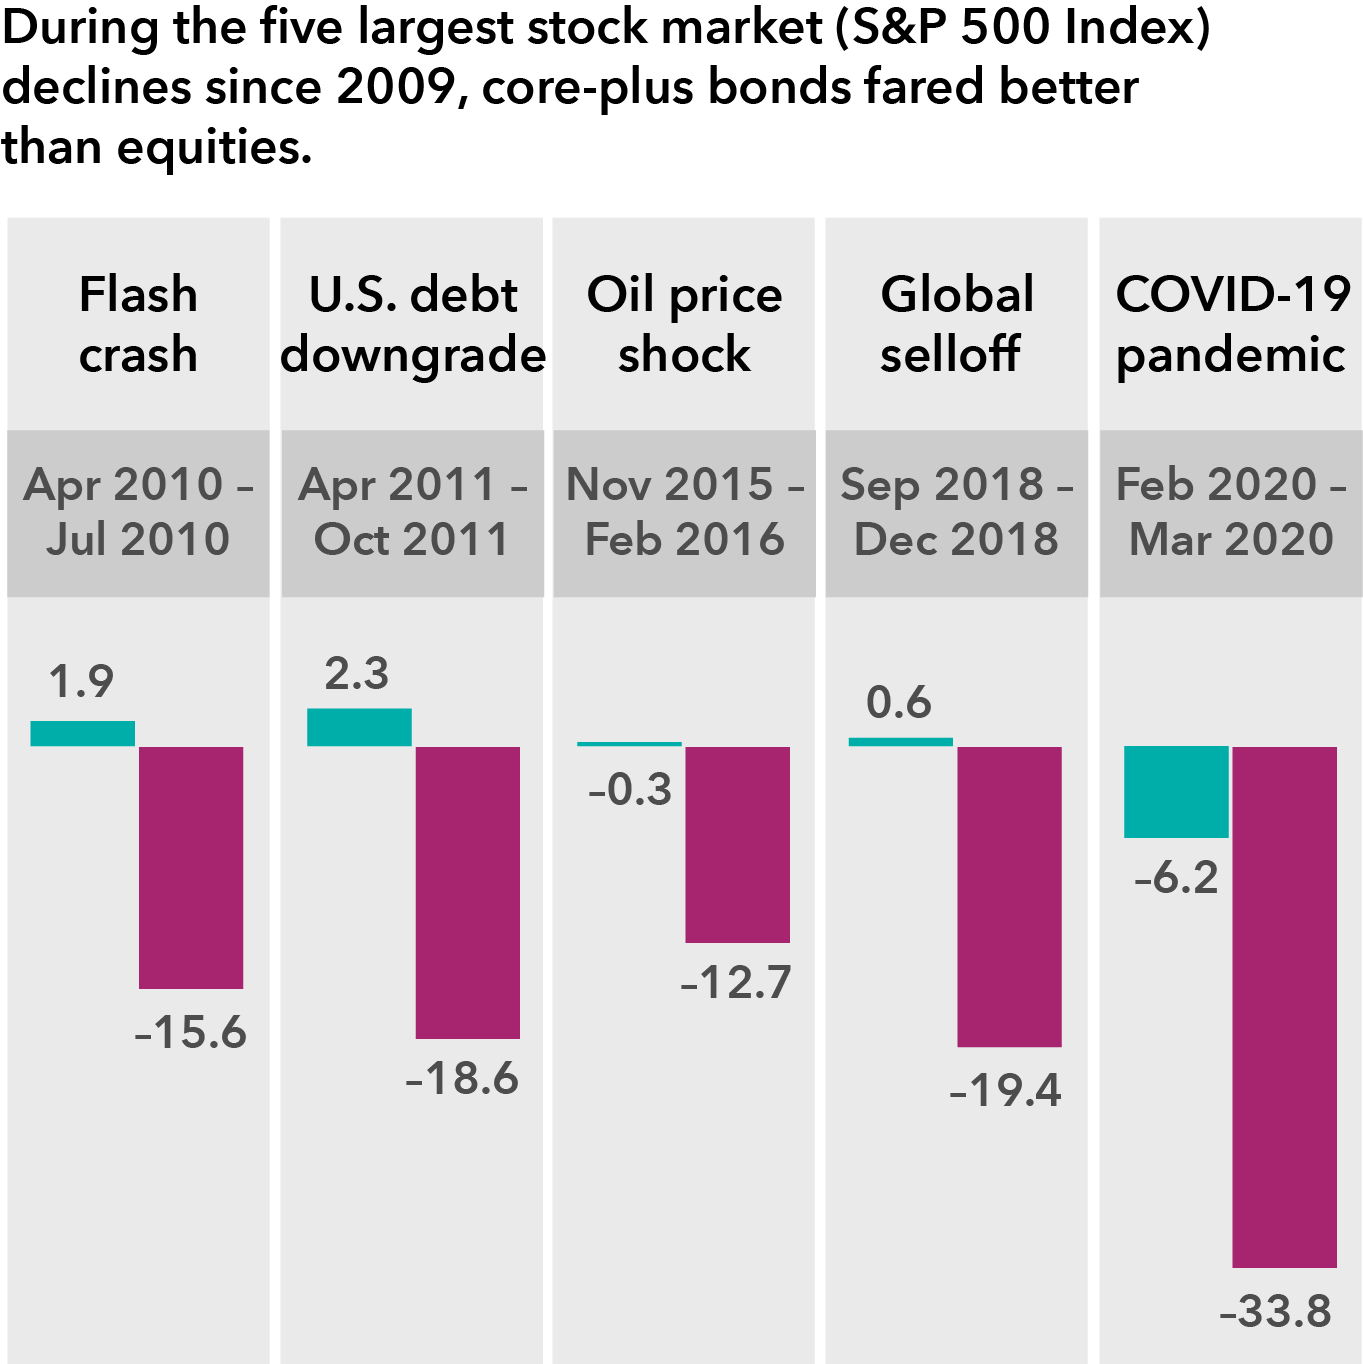
Core plus

Consider core-plus bond funds to mitigate equity volatility

 Morningstar U.S. Intermediate Core-Plus Bond Category Average

 S&P 500 Index


Data as of December, 31, 2022. See disclosure5

A bar chart that shows five sets of double bars, one teal bar, representing the Morningstar U.S. Intermediate Core-Plus Bond Category Average, and one magenta bar, representing the S&P 500 Index. The text above the chart says “During the five largest stock market (S&P 500) declines since 2009, core-plus bonds fared better than equities.” The first set of bars is labeled: Flash crash from April 2010 to July 2010. Core-plus bonds returns 1.9% while equities returned –15.6%. The second set of bars is labeled: U.S. debt downgrade from April 2011 to October 2011. Core-bond funds returned 2.3% while equities returned –18.6%. The third set of bars is labeled: Oil price shock from November 2015 to February 2016. Core-plus bonds returned –0.3% while equities returned –12.7. The fourth set of bars is labeled: Global selloff from September 2018 to December 2018. Core-plus bond funds returned 0.6% while equities returned –19.4%. The fifth set is labeled: COVID-19 pandemic from February 2020 to March 2020. Core-plus bond funds returned –6.2% while equities returned –33.8%.


See disclosure 5

Don't overlook the importance of diversification, particularly when uncertainty abounds. Consider Capital Group Core Plus Income ETF (CGCP), which invests across the fixed income spectrum for the potential to mitigate the downside while pursuing a resilient income stream.
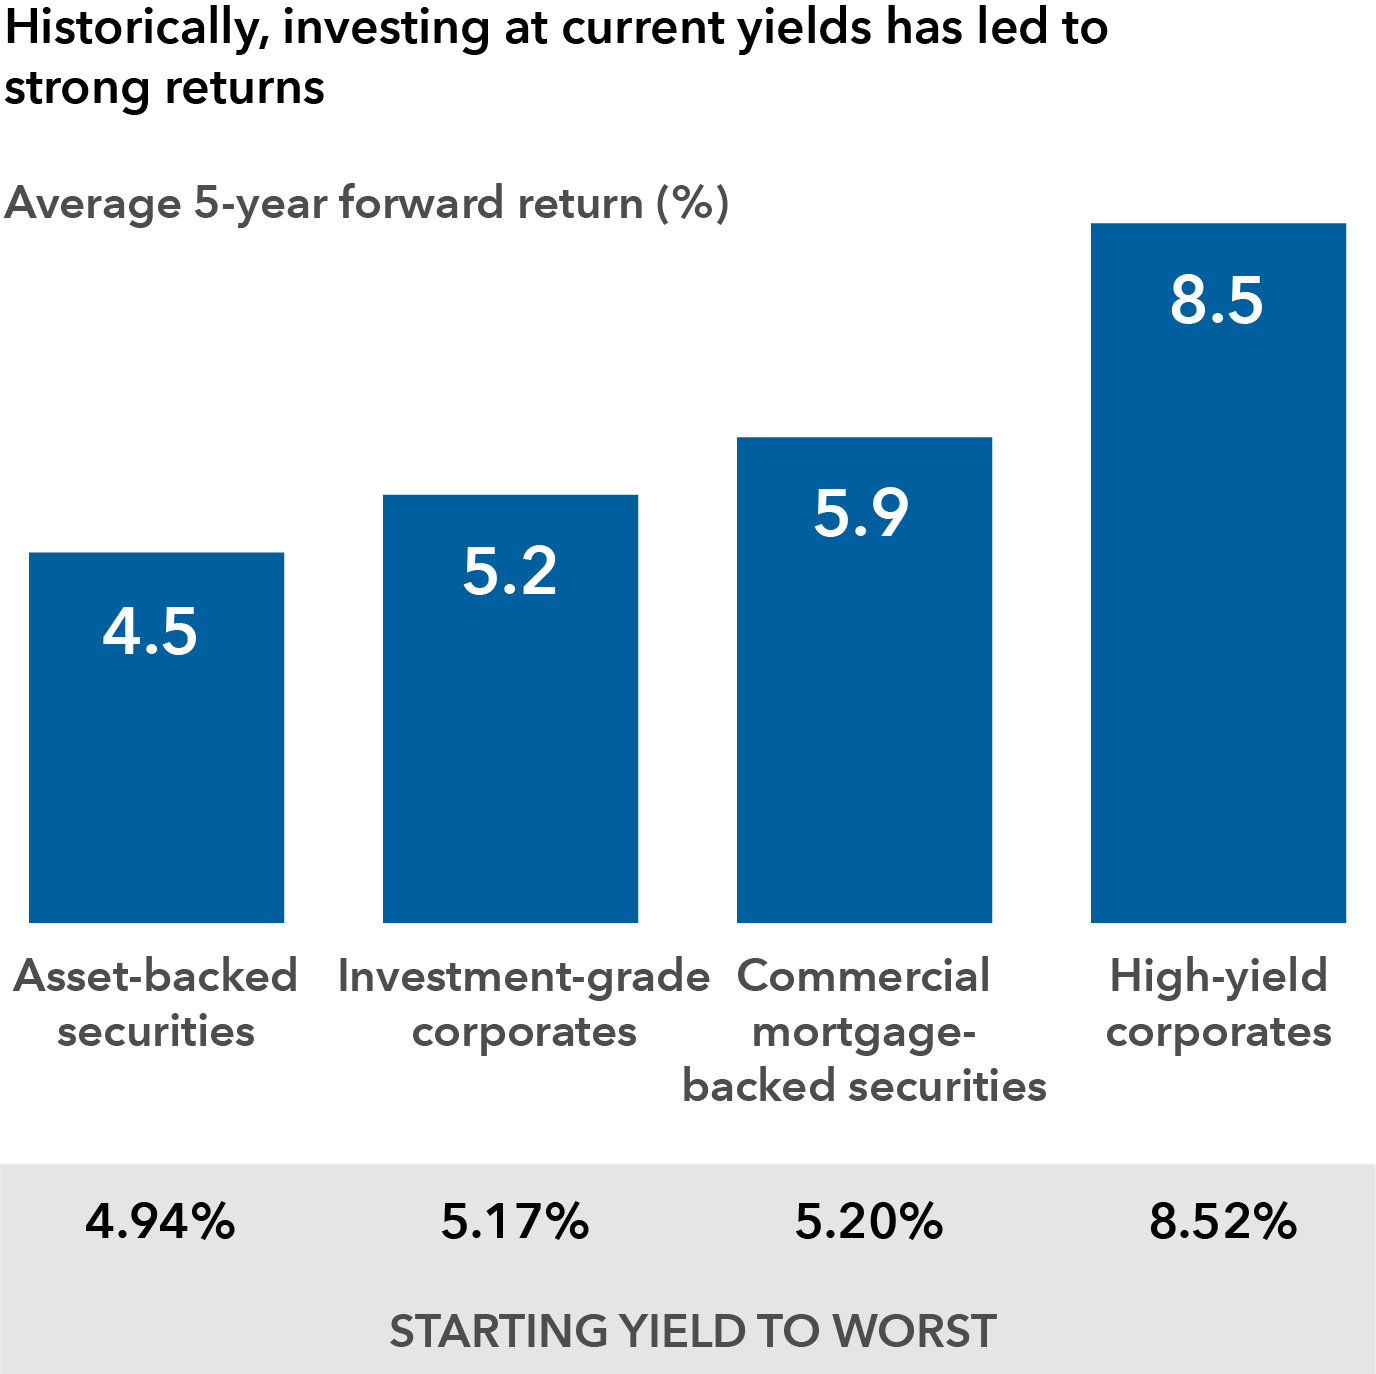
Multisector

Seek a high level of current income


Data as of March 31, 2023. See disclosure6

A bar chart that shows four blue bars. Text above the chart says: Historically, investing at current yields has led to strong returns. Each bar is labeled with a number that indicates the average 5-year forward return (%). Underneath the bars is a gray rectangle that shows the starting yield to worst for each category of bonds shown in the bar chart. The bars are shown in ascending order. Asset-backed securities are first with a 4.5% average 5-year forward return and a 4.94% starting yield to worst. Investment-grade corporates are next with a 5.2% average 5-year forward return and a 5.17% starting yield to worst. Commercial mortgage-backed securities are next with a 5.9% average 5-year forward return and a 5.20% starting yield to worst. The final bar is labeled: High-yield corporates with a 8.5% average 5-year forward return and an 8.52% starting yield to worst.


See disclosure 6

With the ability to flexibly allocate across a broad swath of U.S. bond sectors to pursue income opportunities, Capital Group U.S. Multi-Sector Income ETF (CGMS) seeks multiple sources of income and total return while managing credit risk and volatility.
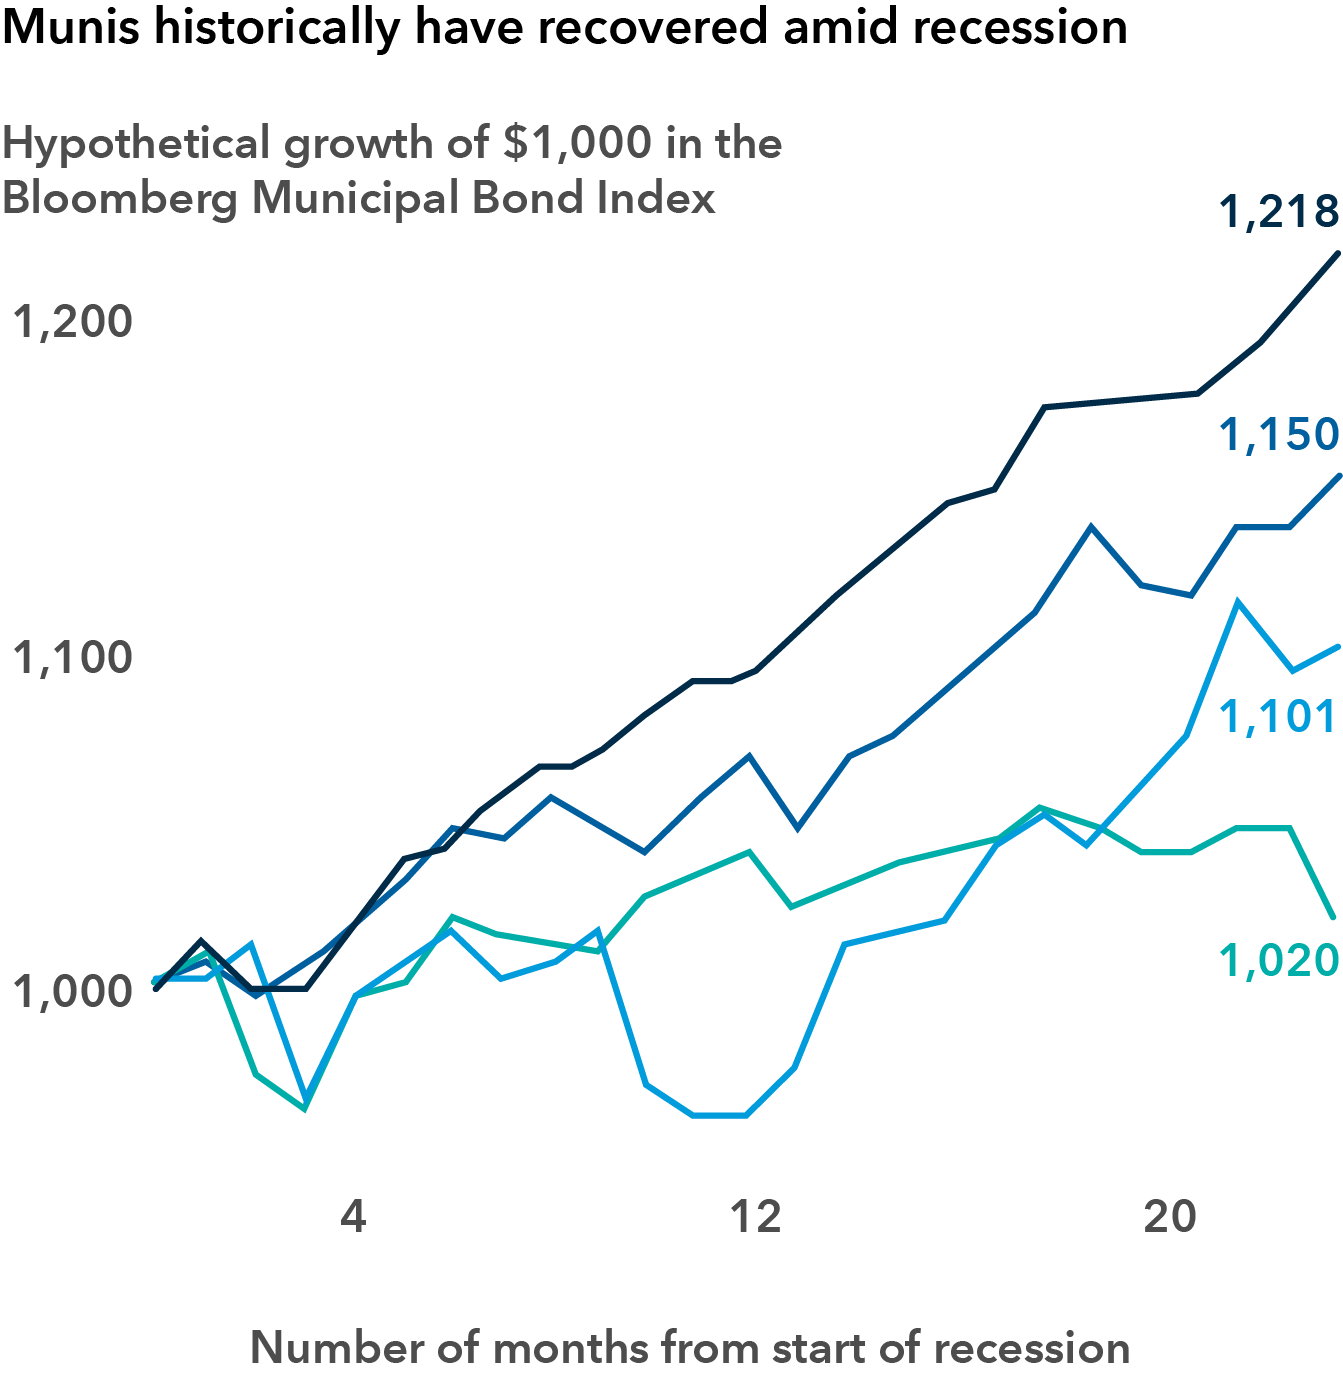
Munis

Consider munis, which have weathered recessions well

Savings and loan recession (July 1990 – March 1991)

Early 2000s recession (March 2001 – November 2001)

Great Recession (December 2007 – June 2009)

COVID-19 recession (February 2020 – March 2020)


Data as of January 31, 2022. See disclosure7

A line chart showing four lines. The chart headline says: Munis historically have recovered amid recession. The y-axis is labeled: Hypothetical growth of $1,000 in the Bloomberg Municipal Bond Index and ranges from 1,000 to 1,200. The x-axis is labeled: Number of months from start of recession and ranges from 0 to 20. The dark blue line represents the savings and loan recession from July 1990 to March 1991 with an ending value of $1,218. The royal blue line represents the early 2000s recession from March 2001 to November 2001 with an ending value of $1,150. The light blue line represents the Great Recession from December 2007 to June 2009 with an ending value of $1,101. The light green line represents the COVID-19 recession from February 2020 to April 2020 with an ending value of $1,020.


See disclosure 7

Interested in pursuing a tax-exempt income stream while preserving capital? Consider Capital Group Municipal Income ETF (CGMU), which invests in multiple potential sources of returns with a broadly diversified municipal bond portfolio.

Disclosure 4
As of December 31, 2022. Source: Bloomberg Index Services, Ltd., Morningstar. Money market: Morningstar Prime Money Market Category (These portfolios invest in short-term money market securities in order to provide a level of current income that is consistent with the preservation of capital) average. While money market funds seek to maintain a net asset value of $1 per share, they are not guaranteed by the U.S. Federal government or any government agency. You could lose money by investing in money market funds. Unlike mutual fund shares, investments in U.S. Treasuries are guaranteed by the U.S. government as to the payment of principal and interest. In addition, certificates of deposit (CDs) are FDIC-insured and, if held to maturity, offer a guaranteed return of principal. 1-3-year taxable: Bloomberg U.S. Aggregate 1-3 Year Index (represents securities in the one to three year maturity range of the U.S. investment-grade fixed-rate bond market), Intermediate taxable: Bloomberg U.S. Aggregate Intermediate Index (represents securities in the two to 10 year maturity range of the U.S. investment-grade fixed-rate bond market), 1-5 year municipal: Bloomberg Municipal Short 1-5 year Index (a market-value-weighted index that includes investment-grade tax-exempt bonds with maturities of one to five years), 1-10 year municipal: Bloomberg Municipal Short Intermediate 1-10 year Index (a market-value-weighted index that includes investment-grade tax-exempt bonds with maturities of one to 10 years), Core: Bloomberg U.S. Aggregate Index (represents the U.S. investment-grade fixed-rate bond market), Treasury: Bloomberg U.S. Treasury Index (represents U.S. dollar-denominated, fixed-rate, nominal debt issued by the U.S. Treasury), Long Treasury: Bloomberg U.S. Long Treasury Index (represents U.S. dollar-denominated, fixed-rate, nominal debt issued by the U.S. Treasury with maturities of ten years or more). The indexes are unmanaged and, therefore, have no expenses. Investors cannot invest directly in an index. Yields for indexes are yield to worst. Money market yield is 7-day SEC yield. Taxable-equivalent yield assumptions are based on a federal marginal tax rate of 37%, the top 2022 rate. In addition, we have applied the 3.8% Medicare tax. The fixed-year standard deviation measures the variability of returns over the preceding 60-month period.

Disclosure 5
Source: Capital Group, Morningstar. As of 6/30/21. Dates shown are representative of the five largest equity market declines (without dividends reinvested) in the S&P 500 Index with at least 50% recovery persisting for more than one business day between declines. The returns are based on total returns. The index is unmanaged and, therefore, has no expenses. Investors cannot invest directly in an index. Funds within the Morningstar U.S. Intermediate Core-Plus Bond Category invest primarily in investment-grade U.S. fixed income issues including government, corporate and securitized debt, but generally have greater flexibility than core offerings to hold non-core sectors such as corporate high yield, bank loan, emerging markets debt and non-U.S. currency exposures.

Disclosure 6
Sources: Capital Group, Bloomberg. Yields and monthly return data as of March 31, 2023, going back to January 2000 sectors shown. Based on average monthly returns for each sector when in a +/- 0.30% range of yield to worst (the lowest yield that can be realized by either calling or putting on one of the available call/put dates, or holding a bond to maturity) shown. Sector yields above include Bloomberg Asset Backed Securities Index (represents the universe of U.S. asset-backed securities), Bloomberg U.S. Investment Grade Corporates Index (representing the universe of investment-grade publicly issued U.S. corporate and specified foreign debentures and secured notes that meet the specified maturity, liquidity and quality requirements), Bloomberg Commercial Mortgage Backed Securities Index (representing the universe of U.S. commercial mortgage-backed securities) and Bloomberg U.S. Corporate High Yield Index (representing the universe of fixed-rate, non-investment-grade corporate bond market). The indexes are unmanaged and, therefore, have no expenses. Investors cannot invest directly in an index. Sectors were selected to reflect the broad investment universe of CGMS with the ABS and CMBS indexes representing the typical issuers that make up the securitized sector of the U.S. fixed income market. Past results are not predictive of results in future periods.

Disclosure 7
Sources: Capital Group, Bloomberg, National Bureau of Economic Research. Data as of 1/31/22. Growth represented by Bloomberg Municipal Bond Index (a market-value-weighted index designed to represent the long-term investment-grade tax-exempt bond market). The index is unmanaged and, therefore, has no expenses. Investors cannot invest directly in an index. Past results are not predictive of results in future periods.

Stay informed

Sign up to make sure you don't miss upcoming Capital Group ETFs insights like these.


This content is intended for financial professionals only and is subject to your home office restrictions.

To find your CRD# go to adviserinfo.sec.gov.

*REQUIRED FIELDS

ETFs for the core (& more)  

Learn about our equity and fixed income ETFs and access ETF insights

Consider active fixed income ETFs

Explore these ideas in-depth and learn why active bond ETFs may be compelling now

Fixed income at Capital Group

Anchored in 50 years of active fixed income investing

The image shows a large 50 in shades of blue. Copy says: 50 years of fixed income investing.
Investments are not FDIC-insured, nor are they deposits of or guaranteed by a bank or any other entity, so they may lose value.
Investors should carefully consider investment objectives, risks, charges and expenses. This and other important information is contained in the fund prospectuses and summary prospectuses, which can be obtained from a financial professional and should be read carefully before investing.
Capital Group exchange-traded funds (ETFs) are actively managed and do not seek to replicate a specific index. ETF shares are bought and sold through an exchange at the then current market price, not net asset value (NAV), and are not individually redeemed from the fund. Shares may trade at a premium or discount to their NAV when traded on an exchange. Brokerage commissions will reduce returns. There can be no guarantee that an active market for ETFs will develop or be maintained, or that the ETF's listing will continue or remain unchanged.
There may have been periods when the results lagged the index(es) and/or average(s). The indexes are unmanaged and, therefore, have no expenses. Investors cannot invest directly in an index.
MSCI has not approved, reviewed or produced this report, makes no express or implied warranties or representations and is not liable whatsoever for any data in the report. You may not redistribute the MSCI data or use it as a basis for other indices or investment products.
Source: Bloomberg Index Services Limited. BLOOMBERG® is a trademark and service mark of Bloomberg Finance L.P. and its affiliates (collectively "Bloomberg"). Bloomberg or Bloomberg's licensors own all proprietary rights in the Bloomberg Indices. Neither Bloomberg nor Bloomberg's licensors approves or endorses this material, or guarantees the accuracy or completeness of any information herein, or makes any warranty, express or implied, as to the results to be obtained therefrom and, to the maximum extent allowed by law, neither shall have any liability or responsibility for injury or damages arising in connection therewith.
FTSE/Russell indexes: London Stock Exchange Group plc and its group undertakings (collectively, the “LSE Group”). © LSE Group 2024. FTSE Russell is a trading name of certain of the LSE Group companies. FTSE indexes are trademarks of the relevant LSE Group companies and are used by any other LSE Group company under license. All rights in the FTSE Russell indexes or data vest in the relevant LSE Group company which owns the index or the data. Neither LSE Group nor its licensors accept any liability for any errors or omissions in the indexes or data and no party may rely on any indexes or data contained in this communication. No further distribution of data from the LSE Group is permitted without the relevant LSE Group company's express written consent. The LSE Group does not promote, sponsor or endorse the content of this communication.
Each S&P Index ("Index") shown is a product of S&P Dow Jones Indices LLC and/or its affiliates and has been licensed for use by Capital Group. Copyright © 2024 S&P Dow Jones Indices LLC, a division of S&P Global, and/or its affiliates. All rights reserved. Redistribution or reproduction in whole or in part is prohibited without written permission of S&P Dow Jones Indices LLC.
All Capital Group trademarks mentioned are owned by The Capital Group Companies, Inc., an affiliated company or fund. All other company and product names mentioned are the property of their respective companies.
Use of this website is intended for U.S. residents only. Use of this website and materials is also subject to approval by your home office.
On or around July 1, 2024, American Funds Distributors, Inc. will be renamed Capital Client Group, Inc.
This content, developed by Capital Group, home of American Funds, should not be used as a primary basis for investment decisions and is not intended to serve as impartial investment or fiduciary advice.
© 2024 Morningstar, Inc. All Rights Reserved. Some of the information contained herein: (1) is proprietary to Morningstar and/or its content providers; (2) may not be copied or distributed; and (3) is not warranted to be accurate, complete or timely. Neither Morningstar, its content providers nor Capital Group are responsible for any damages or losses arising from any use of this information. Past performance is no guarantee of future results. Information is calculated by Morningstar. Due to differing calculation methods, the figures shown here may differ from those calculated by Capital Group.