Retirement Income
Categories
Economic Indicators
A caution signal for the U.S. equity market?
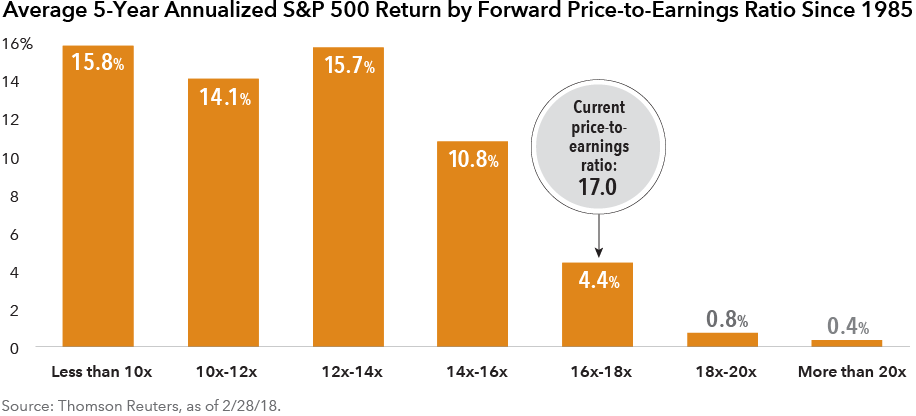
U.S. equity markets have been on an impressive run during the past five years. The S&P 500 Composite Index returned 15.8% on average annually from 2013 through 2017. Many measures of equity market valuations have risen during this time, including the 12-month forward price-to-earnings ratio, which measures current market price against future earnings expectations. The price-to-earnings ratio at the end of February, which was 17.0, may suggest that future stock market returns will be modest. Since 1985, when the S&P 500’s price has been between 16 and 18 times earnings, annual returns in the following five-year period, on average, were around 4%. Whether this relationship will hold true moving forward is uncertain, but a flexible portfolio may help investors pivot should the investment environment become more difficult to navigate.
Learn more about
Past results are not predictive of results in future periods.
The S&P 500 Composite Index (“Index”) is a product of S&P Dow Jones Indices LLC and/or its affiliates and has been licensed for use by Capital Group. Copyright © 2018 S&P Dow Jones Indices LLC, a division of S&P Global, and/or its affiliates. All rights reserved. Redistribution or reproduction in whole or in part are prohibited without written permission of S&P Dow Jones Indices LLC.
Our latest insights
This is the headline for the Newsletter promo. Customize the message.
RELATED INSIGHTS
-
Economic Indicators
-
Monetary Policy
-
Economic Indicators
Never miss an insight
The Capital Ideas newsletter delivers weekly investment insights straight to your inbox.
Statements attributed to an individual represent the opinions of that individual as of the date published and do not necessarily reflect the opinions of Capital Group or its affiliates. This information is intended to highlight issues and should not be considered advice, an endorsement or a recommendation.