Retirement Income
Categories
Defined Contribution
Selecting 401(k) plan funds to weather a bear market
 Steve Deschenes
November 15, 2022
With stocks and bonds falling in tandem, markets are officially in bear market territory, and 401(k) plan participants are likely wondering how their investments will respond. Amid increased volatility and many economists now forecasting an increased probability of a recession, managing risk in retirement plans is just as, if not more, important than ever. While plan sponsors and financial professionals cannot control the market, they do have control over choosing funds for their plan menus that have potential to withstand market gyrations.
Risk matters in retirement plans
The idea of risk management in retirement plans might not typically be top of mind. But a recent study by MetLife found that more than half of plan sponsors (52%) are concerned about the effect of volatility on plan participants that are at least 10 years away from retirement. The percentage increases to 67% and 70% for those within 10 years of retirement and those already in retirement, respectively.
Plan sponsor concerns around participants' ability to weather impact of market volatility
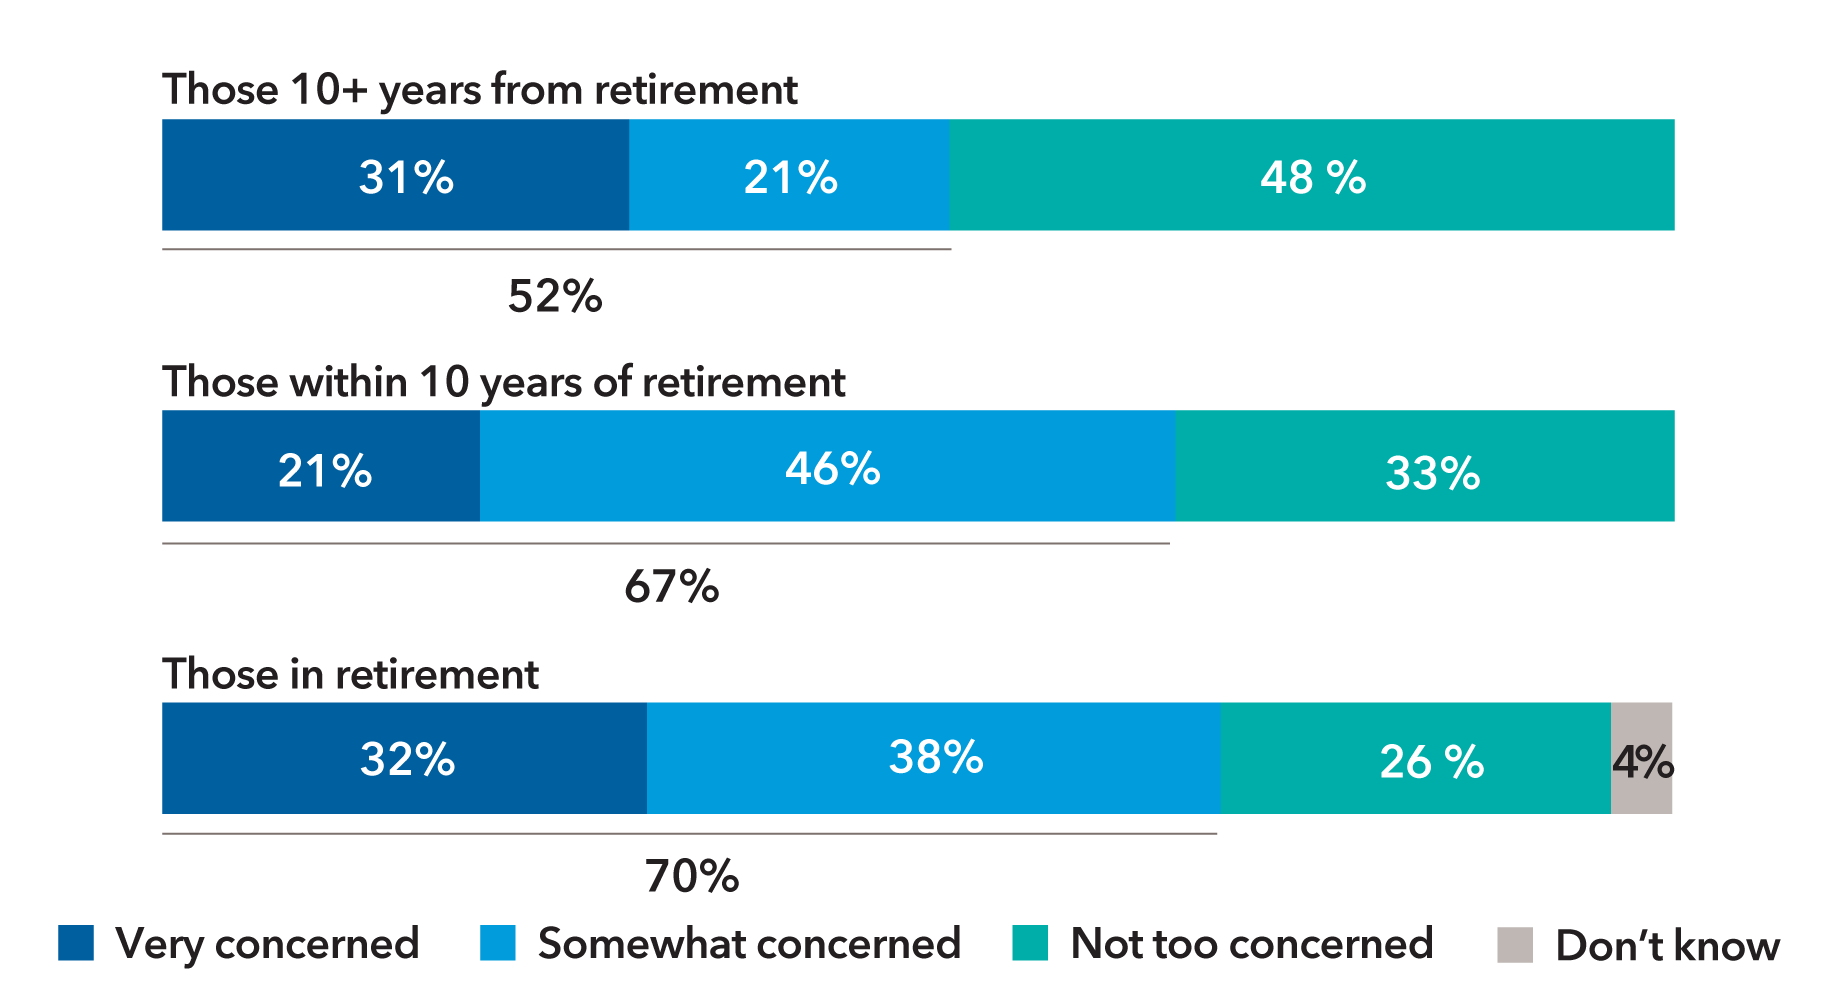
Source: MetLife, "2022 Stable Value Study."
Risk can be a disruptor for participants: Near-retirees may have to delay retirement, and retirees may have to cut spending or even return to the workforce. Younger participants could panic and move into very conservative investments, or even worse, may stop contributing all together.
That’s why it’s critical to help plan sponsors find funds that can help preserve participants’ balances amidst volatile markets while helping them benefit from their upside.
What to consider when making fund selections
To find out which strategies may have the potential to help participants weather down markets, we spent years examining factors that have contributed to better-than-peer and better-than-benchmark results.
Our research identified three common traits that consistently enhanced outcomes:
- Strong downside capture: Downside capture ratio measures a fund’s results relative to its benchmark during periods of market weakness. The lower the ratio, the better the fund held up during market declines. Active funds that have exhibited strong downside capture ratios in previous periods held up better in future down markets and, on average, delivered better long-term results.
- Low expenses: We found that funds that have lower fees than their peers, specifically funds that offer fees in the least expensive quartile, have the potential to deliver better participant outcomes. Ongoing annual expenses can have an impact on long-term results, and ultimately, participant outcomes.
- High level of firm manager ownership: We believe funds managed by portfolio managers with a high level of firm manager ownership in the fund signal high conviction in investment strategies and ideas. And it represents an alignment of interests between fund managers and participants investing in the fund.
Select equity-focused active funds had enhanced outcomes for the 26 years ending December 31, 2021
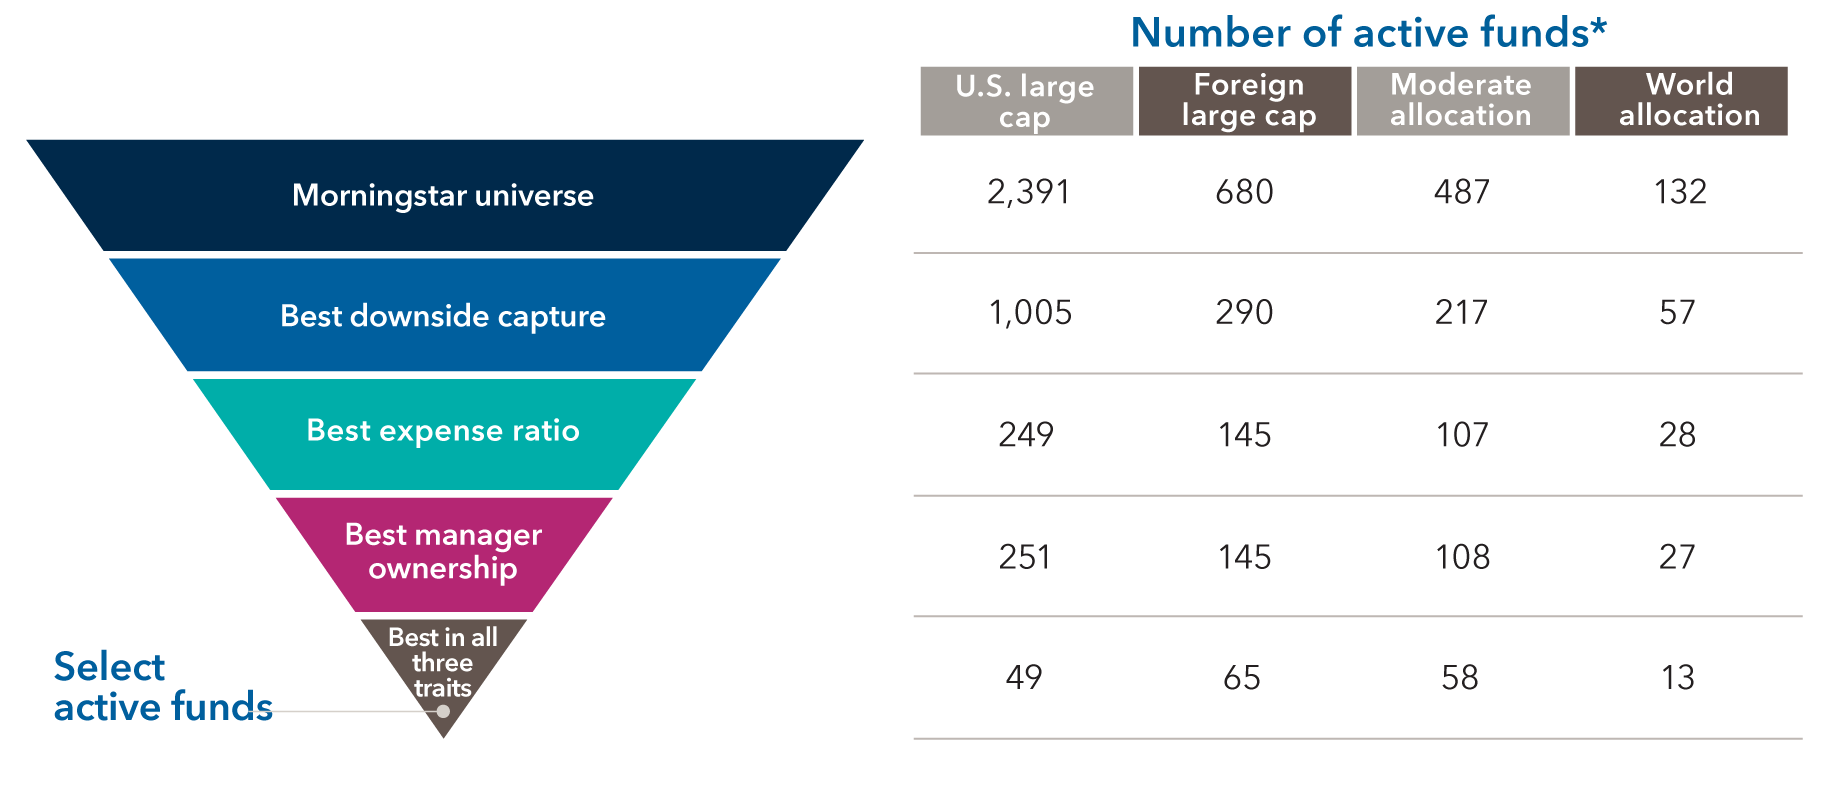
Sources: Capital Group, Morningstar. Covers the period of January 1, 1996, to December 31, 2021. Screens were based on historical fund performance in comparison with peer median. Best downside capture was defined as top 50%. Best expense ratio and best manager ownership were defined as top 25% for the U.S. large cap category (owing to its larger sample size) and top 50% for the other categories. Large-cap stocks are defined as the group that accounts for the top 70% of the capitalization of the Morningstar domestic stock universe. Foreign large-cap stocks have market caps in the top 70% of each economically integrated market (such as Europe or Asia ex-Japan); these portfolios typically will have less than 20% of assets invested in U.S. stocks. Moderate-allocation portfolios seek to provide both capital appreciation and income by investing in three major areas: stocks, bonds, and cash. These portfolios tend to hold larger positions in stocks than conservative-allocation portfolios. These portfolios typically have 50% to 70% of assets in equities and the remainder in fixed income and cash. World-stock portfolios have few geographical limitations. It is common for these portfolios to invest the majority of their assets in the U.S., Europe, and Japan, with the remainder divided among the globe's smaller markets. These portfolios typically have 20%-60% of assets in U.S. stocks.
*Comparisons used an asset-weighted methodology. This method can increase comparability between portfolios as compared with an equal-weighted methodology.
What this means for participants
So how can these three intuitive traits — strong downside capture, low expenses and high level of manager ownership — translate into better participant outcomes? To find out, we looked at hypothetical participant scenarios in both accumulation and withdrawal phases.
In the hypothetical example below, we found that over a 26-year accumulation period, a hypothetical $100,000 investment in an equal blend of the U.S. large cap and foreign large cap funds that possessed these three key traits would have delivered 20% greater wealth than the index.
The potential for greater wealth in the accumulation phase ...
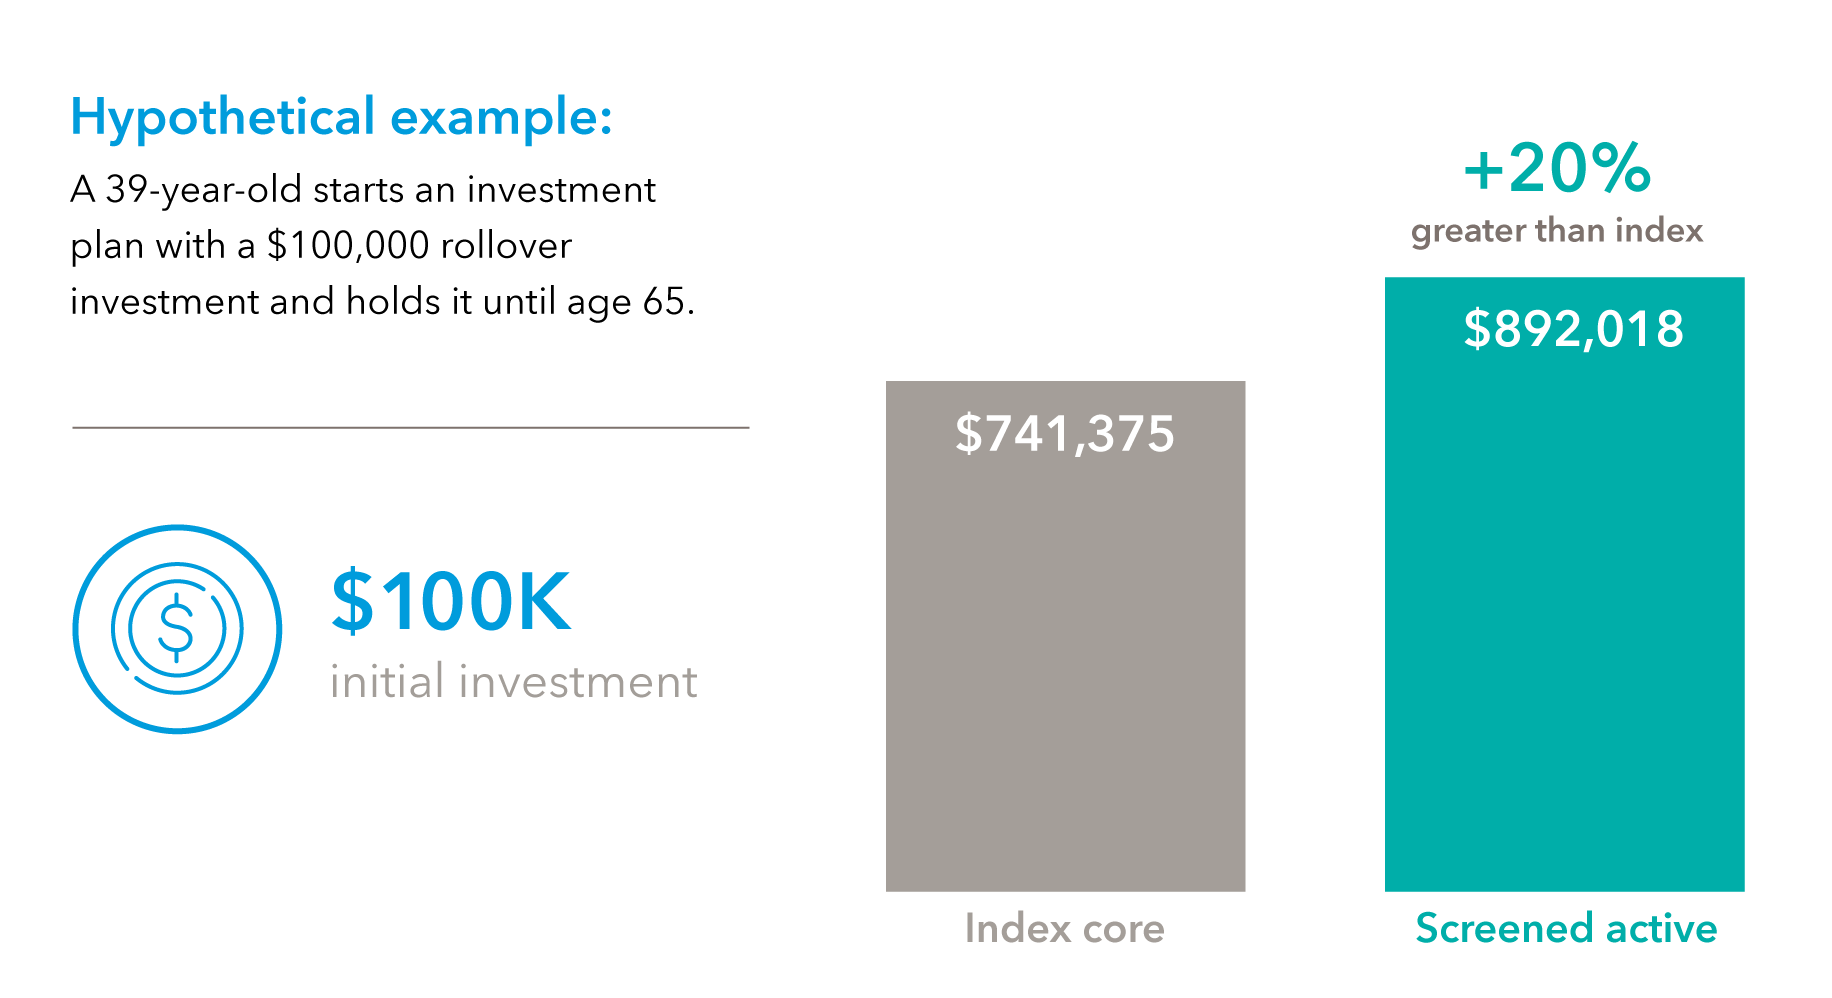
Sources: Capital Group, Morningstar. Time period from 1996 to 2021. Index core consists of 50% S&P 500 and 50% MSCI ACWI ex USA, rebalanced monthly. Screened active portfolio consists of 50% U.S. large cap and 50% foreign large cap. U.S. large cap funds compromise those in the top 25% of lowest expense and highest firm manager ownership of funds after top 50% downside capture filter. Foreign large cap funds have the top 50% lowest expenses and highest 50% firm manager ownership of funds after top 50% downside capture filter. Screened active managers use the oldest share class. The funds in the hypothetical portfolio were equal weighted at the beginning of the period and rebalanced monthly. New funds that incepted during the period and funds that went obsolete (merged or liquidated) during the period were included or excluded in the monthly rebalance, respectively. Past results are not predictive of results in future periods.
… and where risk really matters: in retirement
The lower risk approach made the differences even larger in the distribution phase. The below chart depicts three hypothetical withdrawal scenarios over 26 years in retirement, all starting with a $500,000 nest egg, with initial withdrawal rates of 3%, 4% and 5%. In all three hypothetical scenarios, there would have been substantial appreciation beyond the original principal.
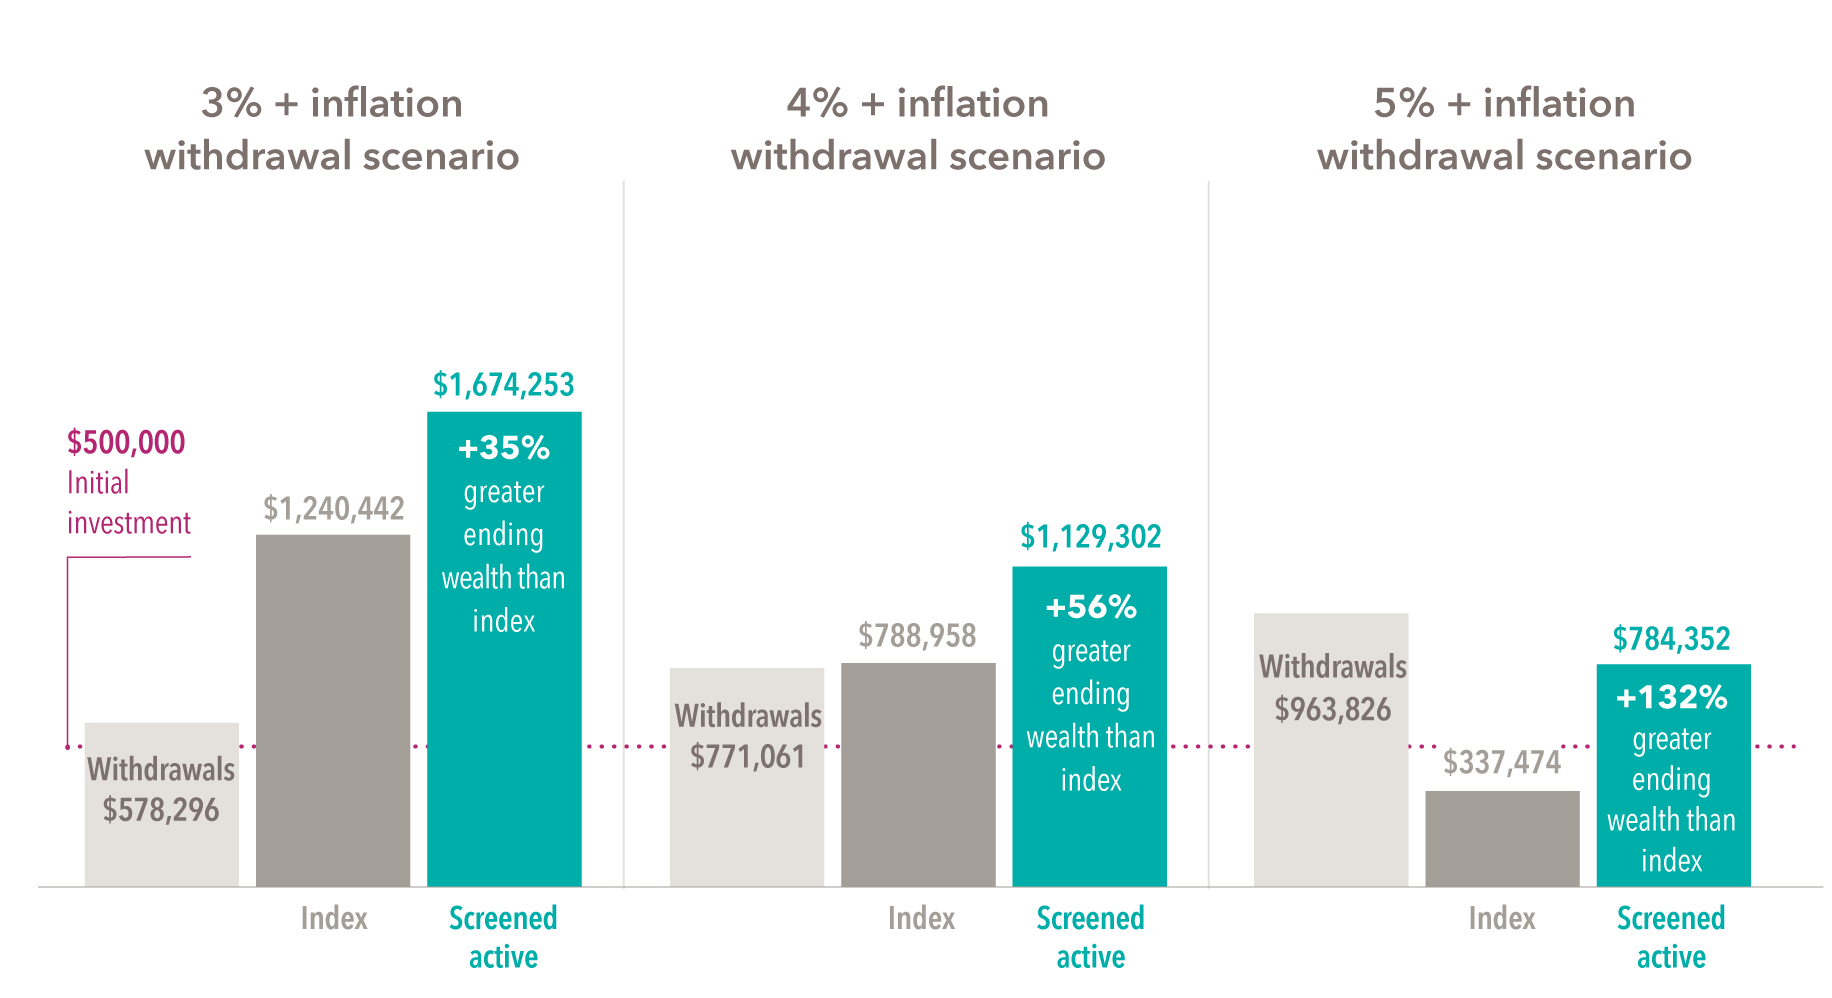
Source: Capital Group, Morningstar. Return of a hypothetical $500,000 initial investment, assuming an initial percentage withdrawal rate, increasing by 3% each year thereafter for inflation, for a 50% moderate allocation/50% world allocation portfolio. For the 26 years ending December 31, 2021. Index comprises 60% MSCI All Country World Index and 40% Bloomberg Global Aggregate Index. Screened active comprises a 50% moderate allocation and 50% world allocation. World allocation and moderate allocation use top 50% expense ratio and top 50% ownership after top 50% downside capture filter. The funds in the hypothetical portfolio were equal weighted at the beginning of the period and rebalanced monthly. New funds that incepted during the period and funds that went obsolete (merged or liquidated) during the period were included or excluded in the monthly rebalance, respectively. Screened active managers use oldest share class. There may have been periods when the fund(s) lagged the index(es). Market indexes are unmanaged and, therefore, have no expenses. Investors cannot invest directly in an index. Past results are not predictive of results in future periods.
The above chart shows an assumed inflation rate of 3%. Imagine the impact on risk of today’s much higher inflation rate, especially if it persists for a significant period of time.
At a 3% initial withdrawal rate, the participant withdrew over $500,000 and would have ended up with 35% greater wealth than the index. At the higher 5% rate, the participant took out over $900,000 from that same $500,000 starting point and would have ended up with 132% greater wealth than the index. If they were to try to do this with the index, they would have less money than their initial investment.
Better investment decisions drive better participant outcomes
While past results are no guarantee of similar results in future periods, these differences can be meaningful for retirees. Even a slightly higher annual return combined with greater downside protection can dramatically extend a participant’s retirement savings, providing them with more flexibility to deal with inflation and unexpected health care expenses and even the potential to leave a legacy for the next generation. With all this in mind, investment selection might be the most important decision you can help plan sponsors make.
Learn more about
Asset weighting methodology: Where noted, findings were based on asset weighting of funds rebalanced monthly, with portfolios equally weighted and rebalanced monthly. Asset weighting used the following process. For each fund, net returns and asset sizes were gathered for all share classes available during each monthly time period. Returns and fees were then share-class weighted, meaning they were weighted according to the proportion of assets in each share class within each fund. Funds were then designated as active or passive, then grouped by Morningstar category.
Additionally, for exhibits with time periods starting 1996 or later, survivorship bias — the tendency for obsolete funds to be excluded from results studies because they no longer exist — is corrected by including the return and expense history of funds that have merged or closed. (Exhibits with time periods before 1996 reflect either live funds only or a combination of both data types: live funds only and survivorship bias free.) In cases where a fund is merged or closed, its asset weighting is adjusted to zero. For newly created funds, the weight is zero until the period in which it has reported assets, whereupon we use the standard asset-weighting to weight the returns based on asset size.
An asset-weighting methodology is used to more effectively portray the likely experience of market participants in the analyzed period versus an equal-weighting methodology, which is more appropriate when analyzing performance of a specific fund over time, regardless of the size of its assets.
Capture ratio reflects the annualized product of fund versus index returns for all months in which the index had a positive return (upside capture) or negative return (downside capture).
S&P 500 Index is a market capitalization-weighted index based on the average weighted results of approximately 500 widely held common stocks.
Bloomberg Global Aggregate Index represents the global investment-grade fixed income markets.
MSCI All Country World Index is a free float-adjusted, market capitalization-weighted index that is designed to measure results of more than 40 developed and developing country markets. Results reflect dividends gross of withholding taxes through 12/31/00, and dividends net of withholding taxes thereafter.
MSCI All Country World ex USA Index is a free float-adjusted, market capitalization-weighted index that is designed to measure results of more than 40 developed and emerging equity markets, excluding the United States. Results reflect dividends gross of withholding taxes through 12/31/00, and dividends net of withholding taxes thereafter.
60%/40% S&P 500 Index/Bloomberg U.S. Aggregate Index blends the S&P 500 with the Bloomberg U.S. Aggregate Index by weighting their cumulative total returns at 60% and 40%, respectively. This assumes the blend is rebalanced monthly.
60%/40% MSCI All Country World Index Gross/Bloomberg Global Aggregate Index blends the MSCI All Country World Index with the Bloomberg Global Aggregate Index by weighting their cumulative total returns at 60% and 40%, respectively. This assumes the blend is rebalanced monthly.
BLOOMBERG® is a trademark and service mark of Bloomberg Finance L.P. and its affiliates (collectively “Bloomberg”). Bloomberg or Bloomberg’s licensors own all proprietary rights in the Bloomberg Indices. Neither Bloomberg nor Bloomberg’s licensors approves or endorses this material, or guarantees the accuracy or completeness of any information herein, or makes any warranty, express or implied, as to the results to be obtained therefrom and, to the maximum extent allowed by law, neither shall have any liability or responsibility for injury or damages arising in connection therewith.
MSCI has not approved, reviewed or produced this report, makes no express or implied warranties or representations and is not liable whatsoever for any data in the report. You may not redistribute the MSCI data or use it as a basis for other indices or investment products.
© 2022 Morningstar, Inc. All rights reserved. The information contained herein: (1) is proprietary to Morningstar and/or its content providers; (2) may not be copied or distributed; and (3) is not warranted to be accurate, complete or timely. Neither Morningstar nor its content providers are responsible for any damages or losses arising from any use of this information. Past performance is no guarantee of future results.
The S&P 500 Index is a product of S&P Dow Jones Indices LLC and/or its affiliates and has been licensed for use by Capital Group. Copyright © 2022 S&P Dow Jones Indices LLC, a division of S&P Global, and/or its affiliates. All rights reserved. Redistribution or reproduction in whole or in part is prohibited without written permission of S&P Dow Jones Indices LLC.
Our latest insights
-
-
Retirement Income
-
Target Date
-
Practice Management
-
Participant Engagement
RELATED INSIGHTS
-
Participant Engagement
-
Practice Management
-
Never miss an insight
The Capital Ideas newsletter delivers weekly investment insights straight to your inbox.
Investments are not FDIC-insured, nor are they deposits of or guaranteed by a bank or any other entity, so they may lose value.
Investors should carefully consider investment objectives, risks, charges and expenses.
This and other important information is contained in the fund prospectuses and summary prospectuses, which can be obtained from a financial professional and should be read carefully before investing.
Statements attributed to an individual represent the opinions of that individual as of the date published and do not necessarily reflect the opinions of Capital Group or its affiliates. This information is intended to highlight issues and should not be considered advice, an endorsement or a recommendation.
All Capital Group trademarks mentioned are owned by The Capital Group Companies, Inc., an affiliated company or fund. All other company and product names mentioned are the property of their respective companies.
Use of this website is intended for U.S. residents only. Use of this website and materials is also subject to approval by your home office.
On or around July 1, 2024, American Funds Distributors, Inc. will be renamed Capital Client Group, Inc.
This content, developed by Capital Group, home of American Funds, should not be used as a primary basis for investment decisions and is not intended to serve as impartial investment or fiduciary advice.