Economic Indicators
Categories
Dividends
Meta shifts the narrative on dividends in the world of Big Tech
 Chris Buchbinder
 Marc Nabi
 Jacob Gerber
May 15, 2024
Meta’s dividend initiation this year appears to have changed the payout paradigm for Big Tech companies. Soon after, Alphabet and Salesforce followed suit, announcing dividends for the first time.
Investors have historically balked at dividends as a sign of declining growth prospects. That was the signal that investors sent when Microsoft first announced its dividend in 2003. But Meta appears to have successfully changed that narrative. The stock went up 23% following the announcement, accruing almost $200 billion in market cap.
The distinguishing feature today is that the larger cap tech companies have buttressed balance sheets, strong earnings, reasonable valuations and what may be the beginning of an AI megacycle that will require massive amounts of capital expenditure. In this context, the introduction of dividends by both Meta and Alphabet is viewed as a sign of capital discipline and confidence in earnings sustainability.
Big Tech’s foray into dividends
Meta and Alphabet will still spend billions on AI infrastructure. Dividends come after aggressive cost cutting and realignment of resources by many large tech companies. Along with Salesforce’s first-ever dividend of 40 cents per share, total dividend payments from the companies could amount to about $4.2 billion on a quarterly basis.
Tech’s share of dividends is growing
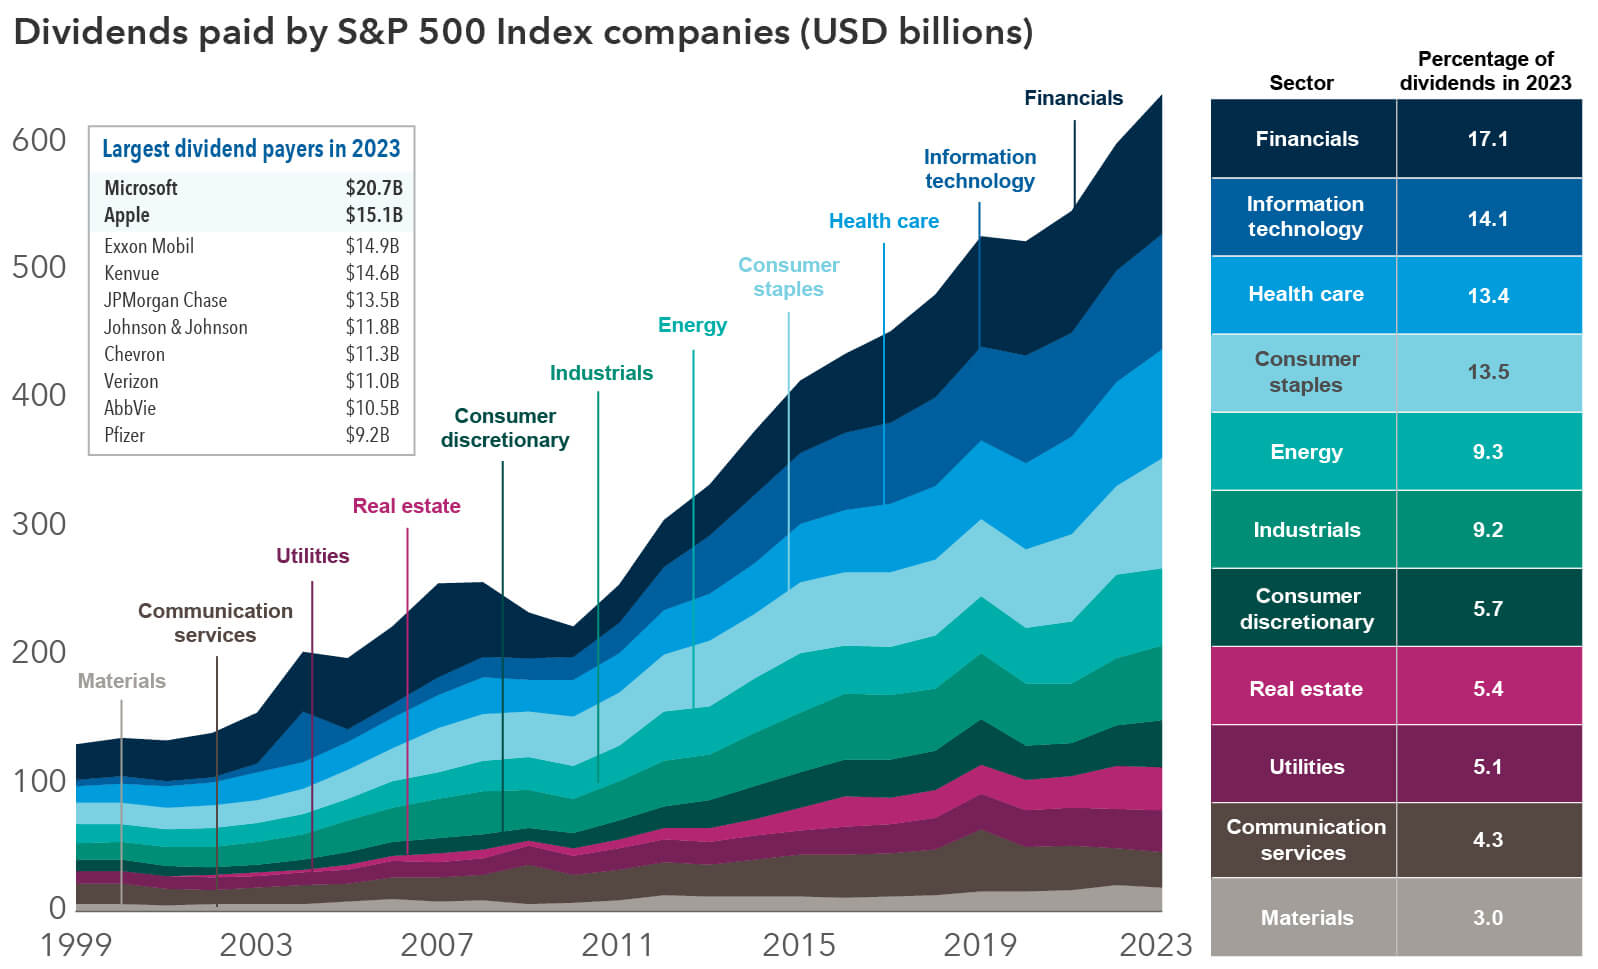
Sources: FactSet, Capital Group. Data from 1999 to 2023.
While dividend-focused investors may not be thrilled with Meta's low dividend of 50 cents per share and dividend yield of 0.4% or Alphabet’s annual dividend of 80 cents and yield of 0.5%, the sheer scale shows substantial payments: $5.1 billion for Meta and $10 billion for Alphabet. And the dividends will likely grow over time, as has been the case with other tech firms. Microsoft's dividend has consistently increased since 2003. Apple initiated its dividend in 2012 and has raised quarterly payouts for 12 straight years.
Tech firms have traditionally leaned on share buybacks, and these will likely continue to be a core part of their overall capital allocation framework. For example, Apple recently announced plans for a record buyback of $110 billion of stock, while Meta authorized a buyback of $50 billion. But an increasing number of tech firms are recognizing that dividends can prove management’s commitment to shareholder returns. Companies are loath to cut their dividends, as it sends a negative signal to investors and often leads to a decline in share price. Furthermore, the dividend is a way the technology giants can potentially expand their base beyond growth-oriented investors.
As tech firms have grown in market cap, the information technology sector has become a bigger part of the overall dividend equation for U.S. stocks. Technology companies ranked as the second-largest contributors to S&P 500 dividends, behind the financial sector and traditional dividend-paying areas of the market, such as health care and consumer staples.
Notably, 37 of the 65 technology companies in the S&P 500 Index pay a dividend. That’s more than half, which also means that there is room for tech companies to grow dividends further. Five of the Magnificent Seven stocks now pay dividends.
Looking beyond tech firms, dividends are growing across industries
Given rising cash flows and expectations of earnings growth for U.S. equities, the outlook for dividend payers is brightening. The S&P 500 is expected to post a 6% increase in payments for 2024, compared to its 5% increase in 2023, according to S&P Dow Jones Indices data.
The dividend futures pricing curve is also significant as market expectations have increased following Meta’s and Alphabet’s announcements. The slope of the curve has steepened and can be used to represent expected dividend growth overtime, in this case, for the current year.
Tech brightens outlook for S&P 500 dividends
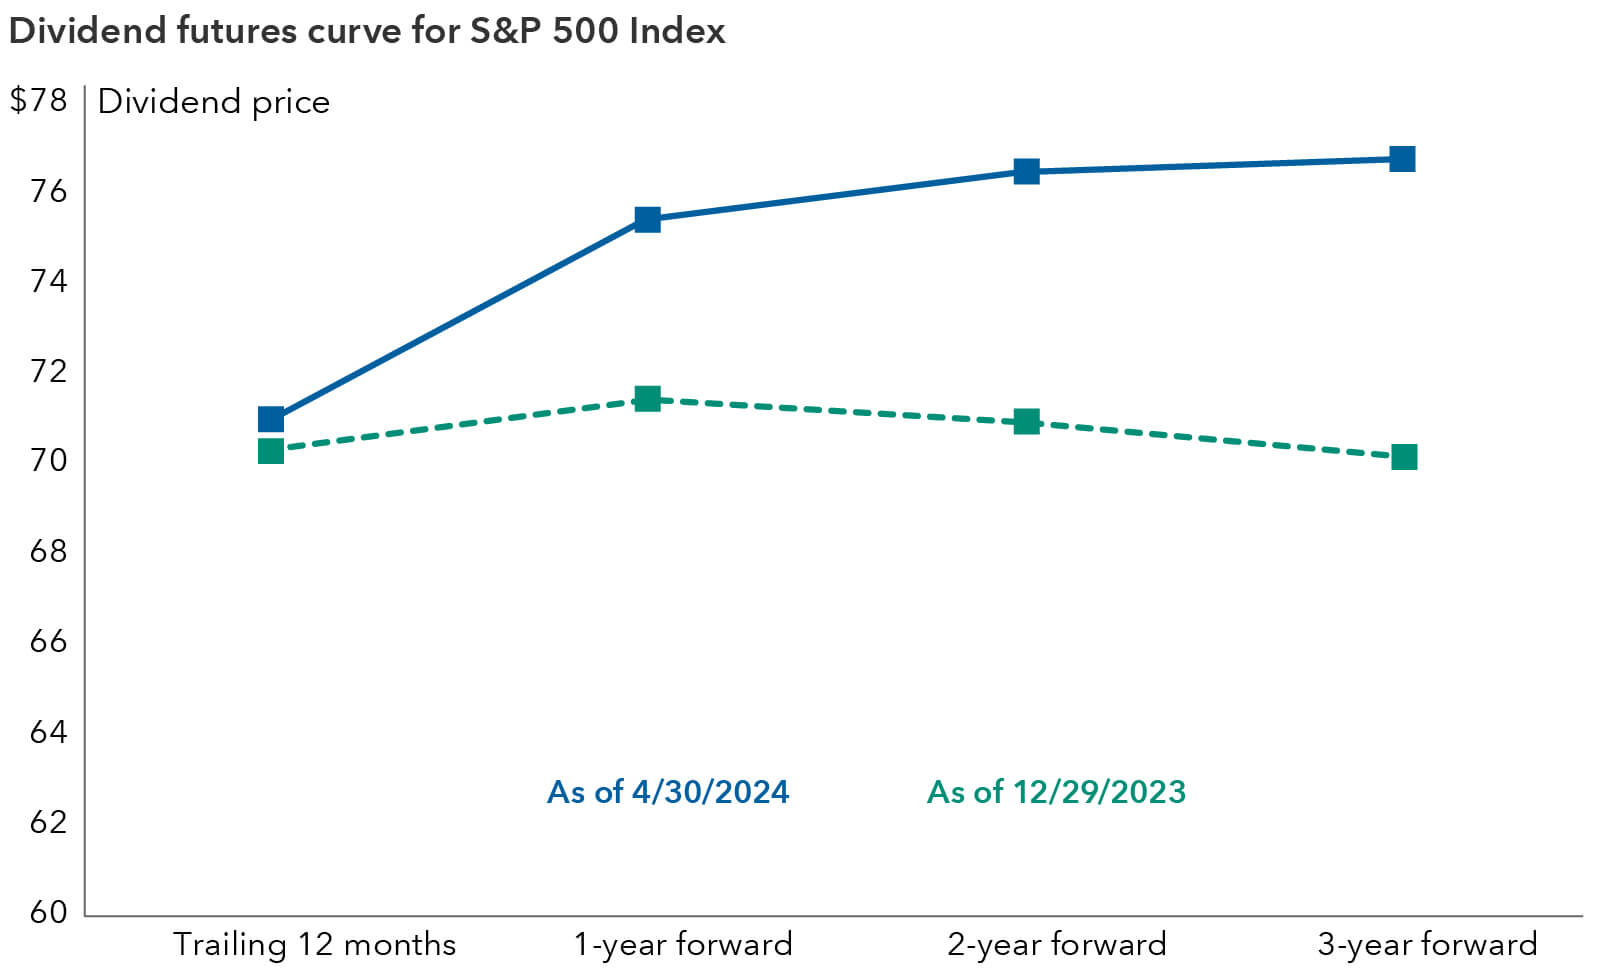
Sources: Capital Group, Bloomberg. Data includes trailing 12-months, 1-year forward, two-year forward, and 3-year forward dividend futures prices as of April 30, 2024.
Dividends are being initiated and restored in many industries. As free cash flows rise on corporate balance sheets, many companies are increasing their payouts or reinstating dividends. Aerospace, airline and cruise companies were among industries that conserved cash during the COVID-19 travel slump and are now shifting gears as global travel rebounds.
Ryanair, for example, announced its first-ever dividend in 2023 after a rebound in profit and a brighter forecast. Booking.com also initiated a dividend, citing earnings and free cash flow strength. Delta Air Lines reinstated its dividend after suspending it during the pandemic. General Electric, which makes and services jet engines, recently boosted its dividend.
Dividends are growing globally. European banks Santander, Deutsche Bank, UniCredit and BNP Paribas have also elected to raise dividends in 2024.
Global dividends are expected to grow
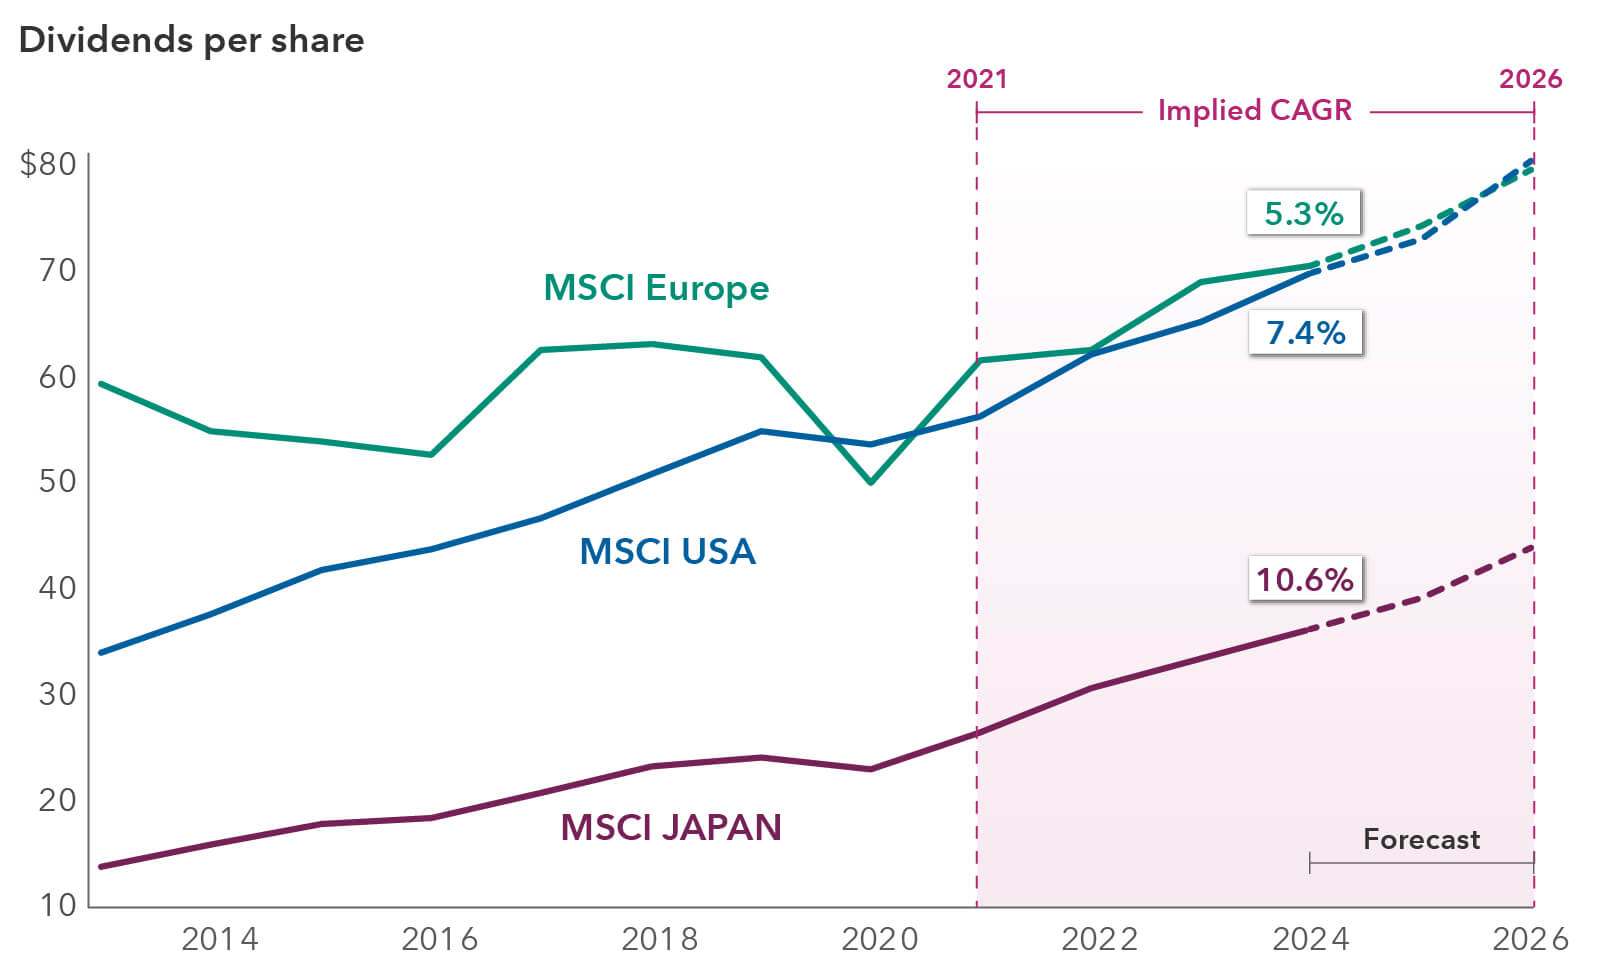
Source: FactSet. Data from 2013 to 2023, with 2024 through 2026 based on consensus estimates as of April 24, 2024. CAGR = compound annual growth rate.
Energy giants such as ExxonMobil and Canadian Natural Resources have maintained a steady base of investors amid volatile oil prices by maintaining and growing their dividend for over 20 years. Some exploration & production companies have opted to incorporate variable or special dividends in addition to their base payouts as they manage cash flow levels given fluctuations in commodity prices.
Bottom line
Dividends benefit management in several ways. First, they can widen a company’s shareholder base. Having more investors can reduce stock volatility by accommodating both growth and dividend income investors. Second, many employees at technology and innovation companies receive shares as compensation. Consequently, a dividend can be seen as an indirect pay raise and boost employee morale.
Over the past 12 months, we have seen signs that the U.S. equity market has broadened beyond a highly concentrated group of stocks, and traditional dividend payers have been garnering more attention. Dividend stocks have the potential to ride out market volatility, along with elevated interest rates.
It’s possible that dividend-paying companies may see a valuation re-rating. The P/E ratio of high-dividend stocks versus the S&P 500 has lagged, though the ratio is gradually improving.
Dividend payers present opportunities
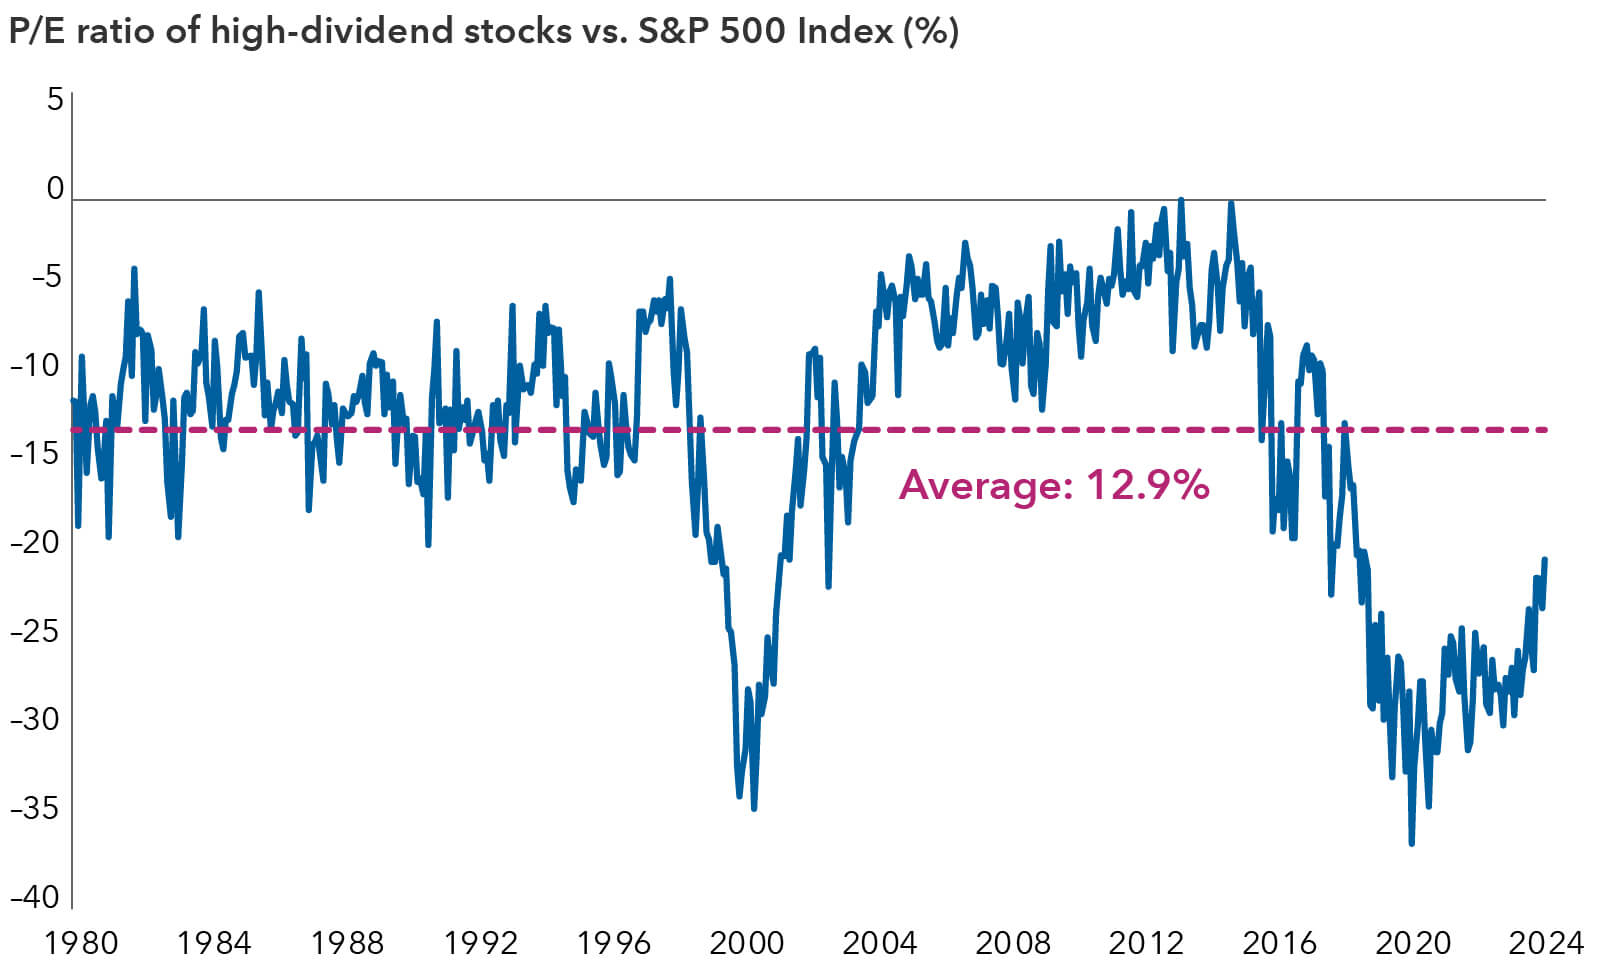
Source: Goldman Sachs. Data as of March 31, 2024. P/E ratio = price-to-earnings ratio. Past results are not predictive of results in future periods. This chart examines the P/E multiple of the cohort of stocks in the S&P 500 Index with the highest quintile dividend yield (sector-neutral) relative to the broader S&P 500.
If the Federal Reserve eventually cuts interest rates, it could also be a catalyst for higher yielding dividend stocks. While a large portion of the nearly $6 trillion in cash sitting on the sidelines may move to fixed income, declining interest rates coupled with a more resilient economic environment could also increase investor demand for these stocks.
Learn more about
The MSCI Japan Index is designed to measure the performance of the large- and mid-cap segments of the Japanese market.
The MSCI USA Index is designed to measure the performance of the large- and mid-cap segments of the US market
The MSCI Europe Index captures large- and mid-cap representation across 15 developed markets (DM) countries in Europe.
S&P 500 Index is a market-capitalization-weighted index based on the results of 500 widely-held common stocks.
The price-to-earnings (P/E) ratio measures a company's share price relative to its earnings per share (EPS).
The Magnificent Seven are a group of large and influential technology and consumer discretionary stocks: Alphabet, Amazon, Apple, Microsoft, Nvidia, Meta and Tesla.
MSCI has not approved, reviewed or produced this report, makes no express or implied warranties or representations and is not liable whatsoever for any data in the report. You may not redistribute the MSCI data or use it as a basis for other indices or investment products.
The S&P 500 (“Index”) is a product of S&P Dow Jones Indices LLC and/or its affiliates and has been licensed for use by Capital Group. Copyright © 2024 S&P Dow Jones Indices LLC, a division of S&P Global, and/or its affiliates. All rights reserved. Redistribution or reproduction in whole or in part is prohibited without written permission of S&P Dow Jones Indices LLC.
Our latest insights
-
-
U.S. Equities
-
-
-
Interest Rates
RELATED INSIGHTS
-
U.S. Equities
-
-
Artificial Intelligence
Never miss an insight
The Capital Ideas newsletter delivers weekly investment insights straight to your inbox.
Investments are not FDIC-insured, nor are they deposits of or guaranteed by a bank or any other entity, so they may lose value.
Investors should carefully consider investment objectives, risks, charges and expenses.
This and other important information is contained in the fund prospectuses and summary prospectuses, which can be obtained from a financial professional and should be read carefully before investing.
Statements attributed to an individual represent the opinions of that individual as of the date published and do not necessarily reflect the opinions of Capital Group or its affiliates. This information is intended to highlight issues and should not be considered advice, an endorsement or a recommendation.
All Capital Group trademarks mentioned are owned by The Capital Group Companies, Inc., an affiliated company or fund. All other company and product names mentioned are the property of their respective companies.
Use of this website is intended for U.S. residents only. Use of this website and materials is also subject to approval by your home office.
On or around July 1, 2024, American Funds Distributors, Inc. will be renamed Capital Client Group, Inc.
This content, developed by Capital Group, home of American Funds, should not be used as a primary basis for investment decisions and is not intended to serve as impartial investment or fiduciary advice.